Exosome / Endocytosis / Phagocytosis | Reagent and Kit Selection Guide
Science Note
Pathogenic EVs in Cancer and Neurodegeneration [Jun. 11, 2026]
|
Extracellular vesicles mediate disease-related cell communication in cancer and neurodegeneration. Recent studies suggest that EV analysis should extend beyond total uptake to include target-cell entry routes, recipient-cell responses, and cargo degradation or release. Tumor-derived sEVs enter cells through defined, subtype-influenced routes and can trigger Ca²⁺ signaling that enhances uptake. In a neurodegeneration model, human microglia took up tau, an aggregation-prone protein linked to Alzheimer’s disease, but incompletely degraded fibrillar tau, releasing aggregation-inducing tau, partly in EV-associated form. |
|||||||||||||||||||
|
Summary: Highlighted technique: For EV uptake and intracellular response analysis, ultracentrifugation-free exosome isolation kit, exosome membrane labeling kit, and intracellular Ca²⁺ ion measurement kit are available. |
|||||||||||||||||||
|
Summary: Highlighted technique: To support research on extracellular tau uptake, microglial responses, and EV-mediated release, tools are available for evaluating endocytosis-related uptake processes and LDH-based cytotoxicity after tau exposure. |
|||||||||||||||||||
Exosome related Indicators (click to open/close)
|
|||||||||||||||||||
What is Plasma Membrane?
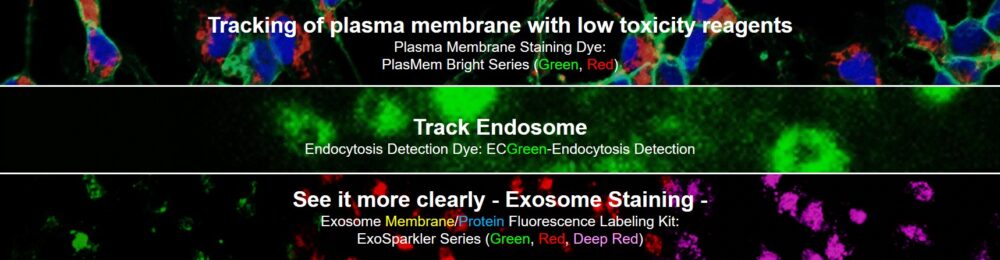
The plasma membrane (PM) separates the intracellular environment from the extracellular space and protects the cells from the extracellular environment. The PM plays important roles in selective permeation or signaling between cells etc. Observing the dynamics of the PM is useful in various research field.
Cell Membrane-related Reagents Selectable by Targets
Selesction Guide

~ Features ~
- Applicable to live and fixed cells
- High retentivity of reagents with low toxicity
- Just add reagents into medium
Low toxicity, No washing, and High retentivity
Comparison with other products
PlasMem Bright Series has low cytotoxicity, and high membrane retention of dyes and can be used in various experiments using live and fixed cells.
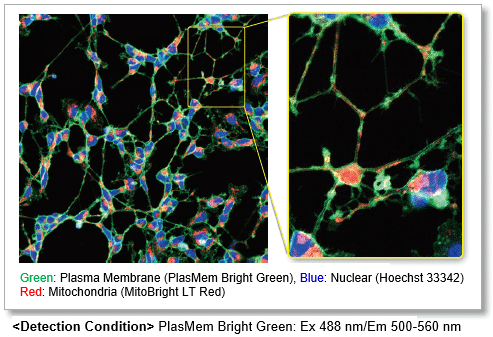
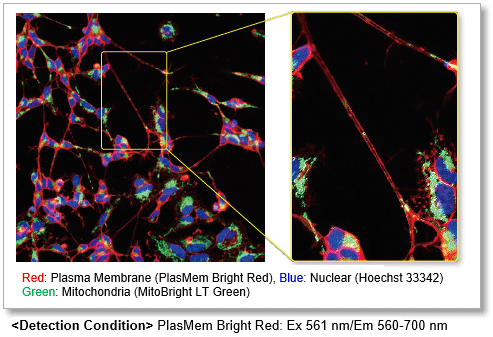
Clear visualization of plasma membrane
Observe morphology of neuron (differentiated SH-SY5Y cells) and localization of mitochondria in axon.
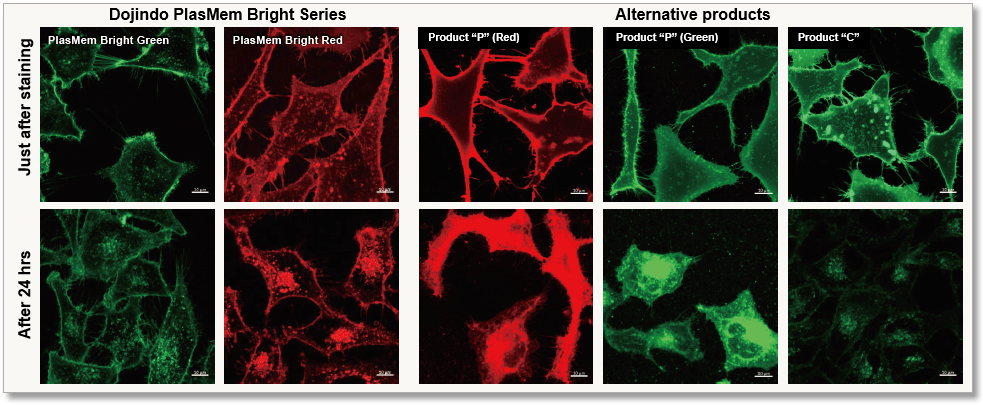
High retentivity on plasma membrane
HeLa cells stained with each plasma membrane staining reagent were incubated for 24 hrs and each the resulting fluorescent image was compared. PlasMem Bright series had higher retentivity in plasma membrane than other products.
| Product | Size | Product Code |
|---|---|---|
| Visualization of Cell membrane | Plasma Membrane Staining Dyes | |
| PlasMem Bright Green | 100 µl x 1 | P504-10 |
| PlasMem Bright Red | 100 µl x 1 | P505-10 |
|
Note: 1 tube (100 µl), 10 assays at 35 mm dish, 10 assays at μ-Slide 8 well |
||
Track endosome

~ Features ~
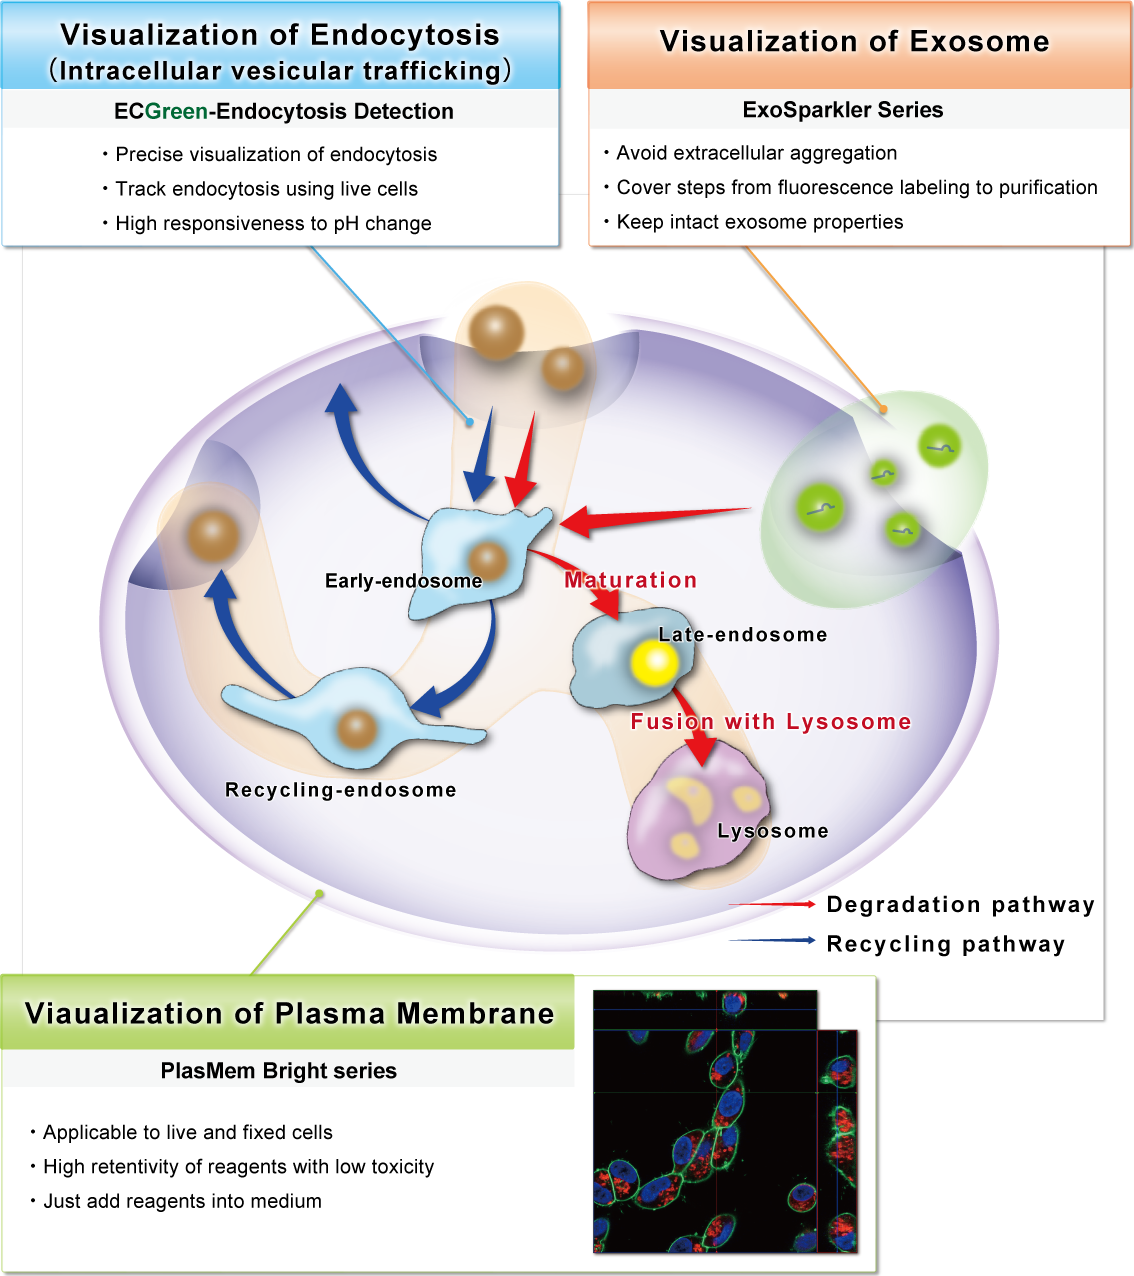
- Precise visualization of endocytosis
- Track endocytosis using live cells
- High responsiveness to pH change
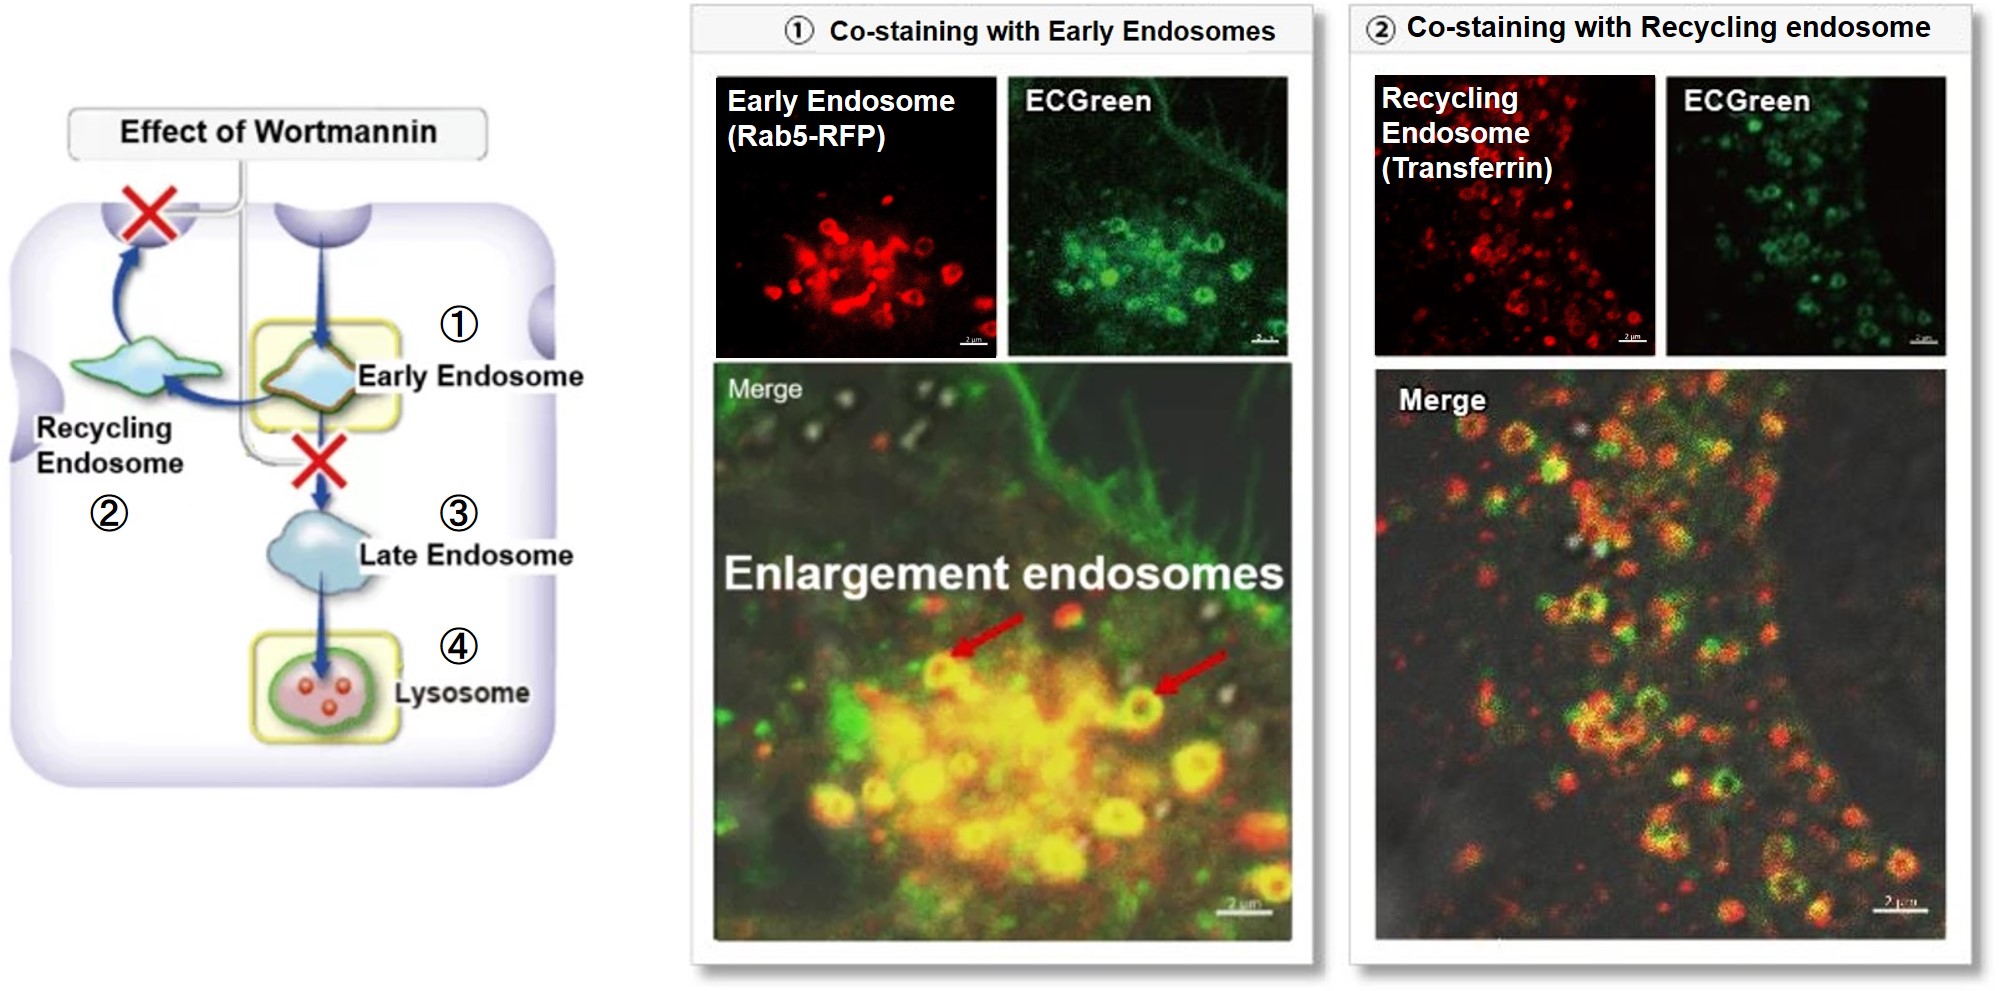
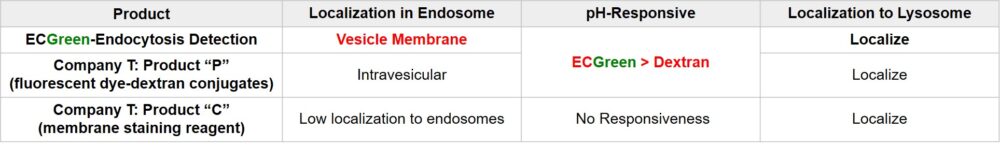
ECGreen is a pH dependent fluorescence dye that localizes to vesicle membrane. The visualization of endocytosis using the ECGreen is a more direct method than fluorescent analogs and allows visualization endocytosis from the stage of early endosomes.
Overall, this results in increased oxidative stress and accelerated cellular damage.
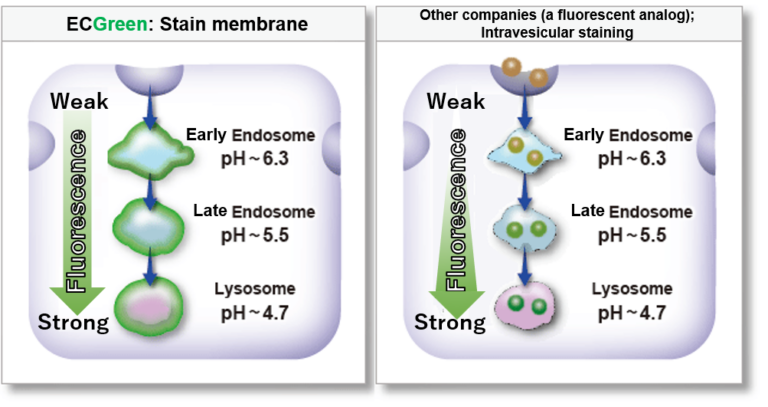
Stain vesicle membrane precisely
Other companies (a fluorescent analog): intravesicular staining
Fluorescent Dye-Dextran Conjugates or membrane staining reagents are used to visualize endocytosis. However, they have limitations in observing dynamics of endosomes in live cells in terms of precision of staining or retentivity of reagent. ECGreen is the reagent that over comes the limitations.
Clear visualization of intracellular vesicular trafficking
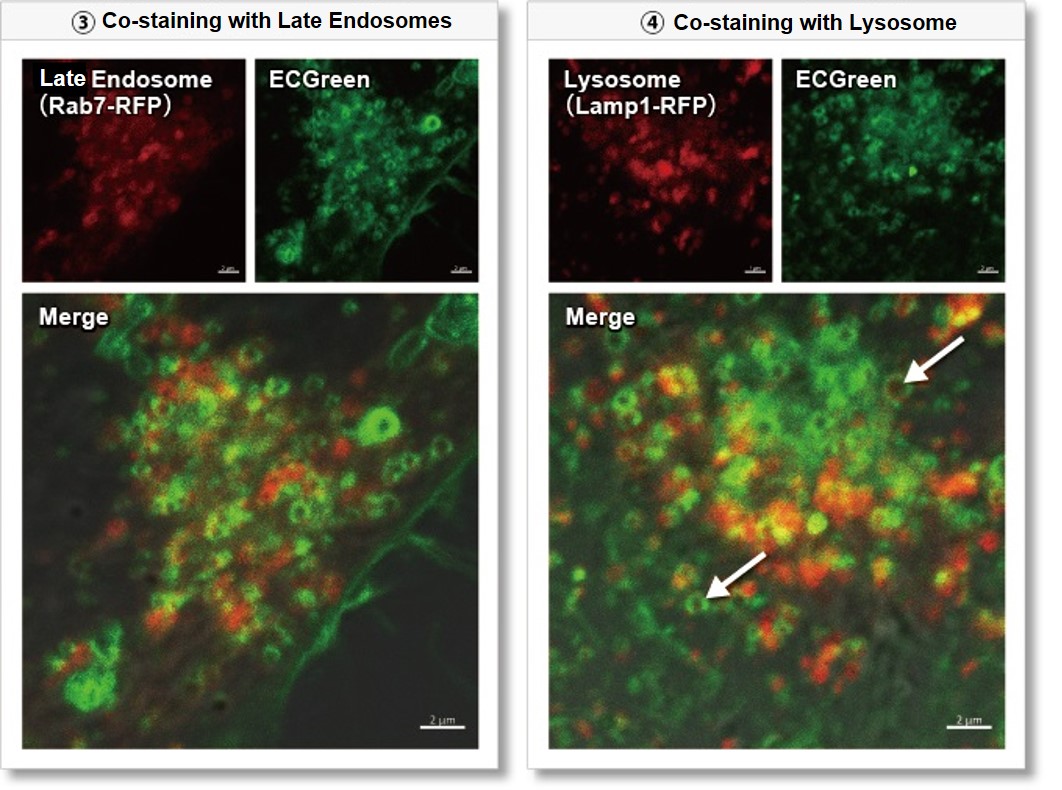
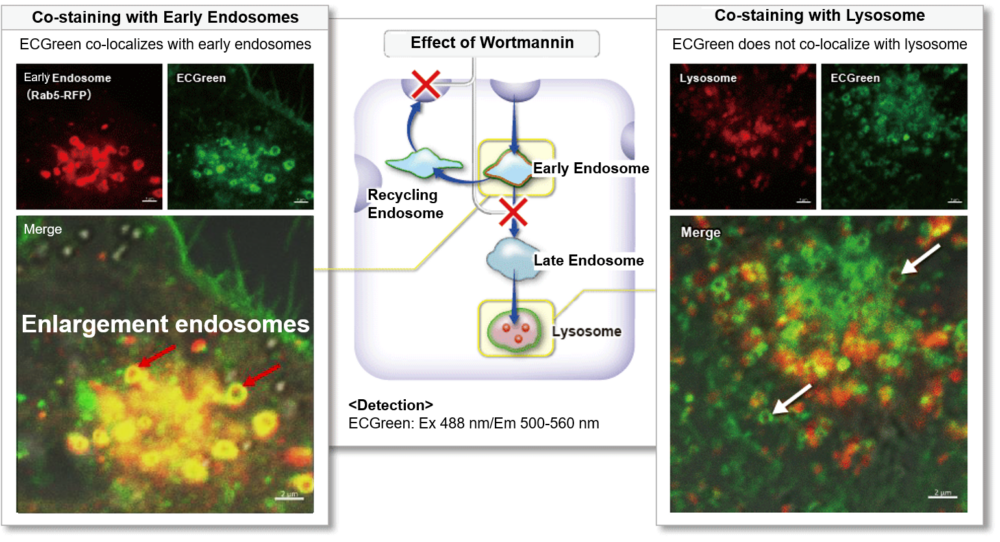
It has been known that Wortmannin inhibits the recycling of endosomes or transition to lysosomes and causes enlargement of endosomes. To evaluate these changes caused by Wortmannin, early endosomes were co-stained by ECGreen and Rab5-RFP (marker protein of early endosomes), and lysosomes were co-stained by ECGreen and lysosome staining reagent. In adding Wortmannin, ECGreen was colocalized with enlarged endosomes (Rab5-RFP). On the other hand, ECGreen wasn’t colocalized with lysosomes.
Track Phagocytosis
~ Features ~
- Label with pH-sensitive fluorescent dye
- All-in-one Kit
- Compatible with phagocytosis assay
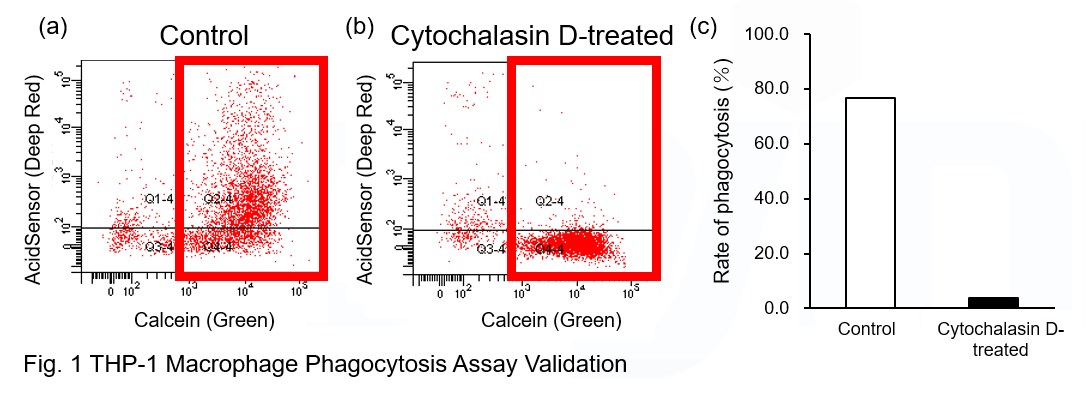
Phagocytosis assay of labeled apoptotic cells in THP-1 cells
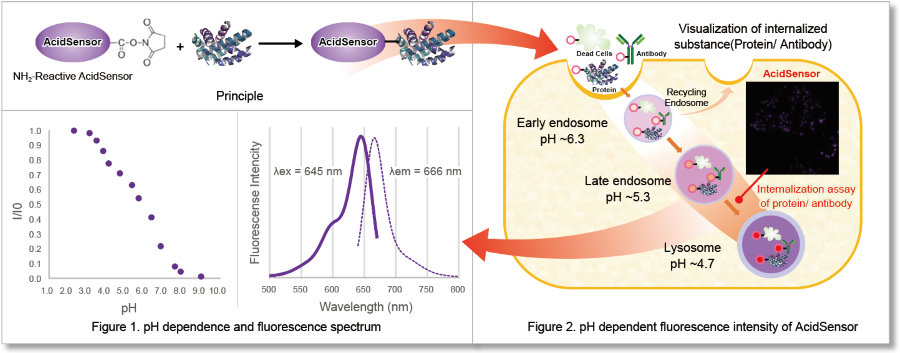
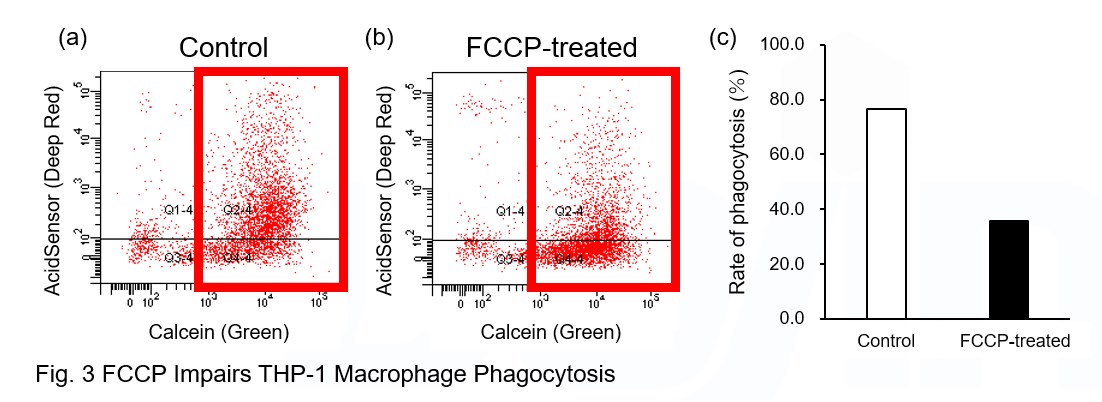
AcidSensor-labeled substances are taken up by cells and their fluorescence increases when they reach acidic organelles such as lysosomes. Taking advantage of this property, we evaluate the phagocytic activity of apoptotic cells by co-culturing AcidSensor-labeled apoptotic cells with Calcein-labeled THP-1 macrophages. As a result, Calcein (Green) / AcidSensor (Deep red) double-positive cells, indicating THP-1 macrophages phagocytosing apoptotic cells, were observed by flow cytometry (Fig. 1a). Furthermore, when the phagocytosis of THP-1 macrophages was inhibited by Cytochalasin D, the percentage of double-positive cells decreased (Fig. 1b and 1c), confirming that the assay system can accurately evaluate phagocytosis.
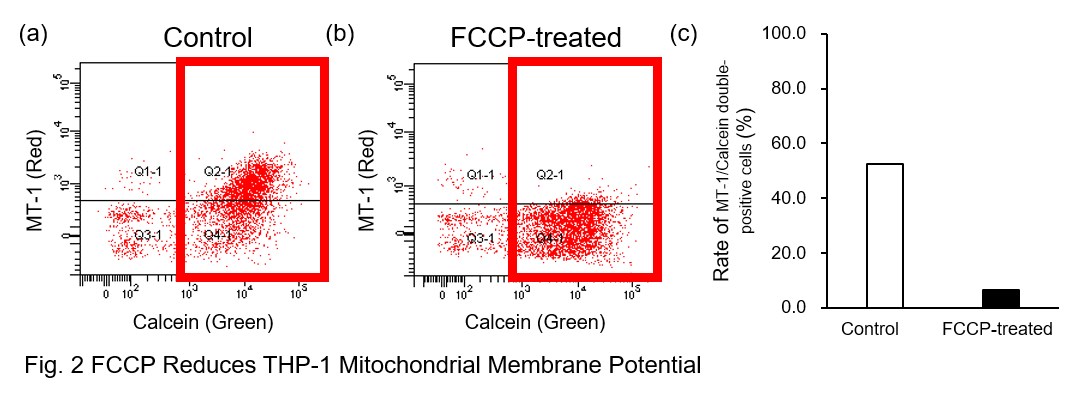
A recent report reveals that inhibition of mitochondrial function induces a switch to glycolysis and reduces phagocytosis in cultured microglia, resident macrophages in the central nervous system*. To replicate this result, phagocytosis assays were performed using mitochondria-inhibited THP-1 macrophages. The results show that FCCP, a potent uncoupler of oxidative phosphorylation in mitochondria, decreases mitochondrial membrane potential (MT-1, Red) of THP-1 macrophages (Fig. 2) and reduces phagocytosis (Fig. 3).
*Lauren H. Fairley, et al., PNAS (2023)
Products in Use
① AcidSensor Labeling Kit – Endocytic Internalization Assay [code: A558]
② -Cellstain- Calcein-AM solution [code: C396]
③ MT-1 MitoMP Detection Kit [code: MT13]
| Product | Size | Product Code |
|---|---|---|
| Visualization of Endocytosis | Endocytosis Detection Dye | |
| ECGreen-Endocytosis Detection | 40 µl x 1 | E296-10 |
|
Note:1 tube (40 µl), 20 assays at 35 mm dish, 20 assays at μ-Slide 8 well |
||
| Product | Size | Product Code |
|---|---|---|
| Visualization of Phagocytosis | Phagocytosis Detection Dye | |
| AcidSensor Labeling Kit | 3 samples | A558-10 |
|
Note:Proteins with a molecular weight above 50,000 can be labeled. |
||
Exosome Membrane/Protein Fluorescence Labeling Kit

~ Features ~
- Not allow extracellular aggregation
- Cover steps from fluorescence labeling to purification
- Little effect on exosome properties
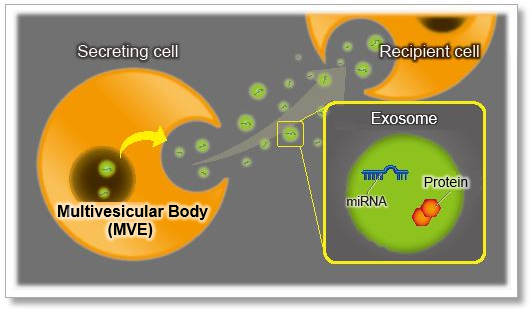
Recent findings suggest that exosomes, a form of extracellular vesicle (EV), contribute to malignant transformation and the metastasis of cancer. Consequently, intercellular communication via exosomes is attracting considerable interest in the scientific community.
To shed light on such communication, labeling techniques based on fluorescent dyes have been used. Fluorescent dyes that label the cellular membrane are commonly used for exosome labeling because the lipid bilayer in exosomes is a good target for labeling.
ExoSparkler series does not allow extracellular aggregation
Exosomes stained with ExoSparkler’s Mem Dye-Deep Red or an alternative product (green or red) were added to each well containing HeLa cells. The labeled exosomes taken into HeLa cells were observed by fluorescent microscopy. As a result, extracellular fluorescent spots suspected of dye aggregations were seen in each well containing the exosomes stained with the alternative product (green or red).
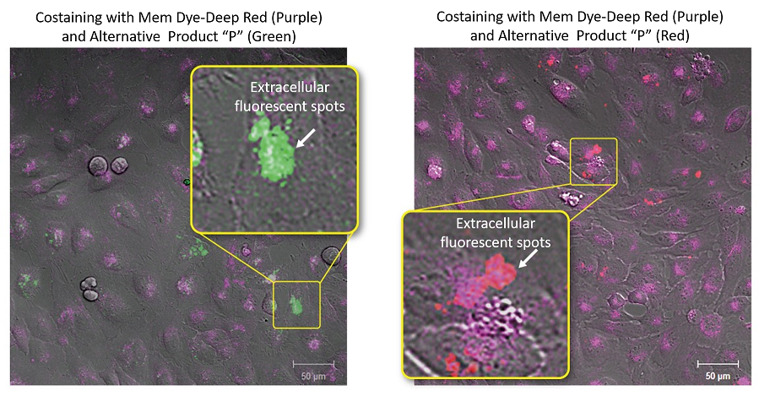
Mem Dye-Deep Red (Purple): Ex 640 nm/Em 640-760 nm
Alternative Product “P” (Green): Ex 561 nm/Em 560-620 nm
Alternative Product “P” (Red): Ex 640 nm/Em 650-700 nm
Mem Dye-Deep Red and Product “P” (Green and Red) in aqueous solution were analyzed by NTA (nanoparticle tracking analysis) to investigate the generation of aggregates. No aggregation was observed in the experiments with Mem Dyes, although Product “P” (Green and Red) produced dye-to-dye aggregates (100–500 nm size).
Instrument: LM10-HSBFT 14 (Nanosight)
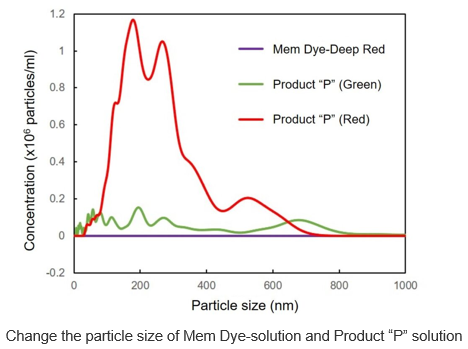
In Mem Dye-Green, Red, the aggregation of the dye was not confirmed as in Mem Dye-Deep Red.
Commonly used exosomal membrane dye can cause dye aggregation, exhibiting fluorescent spots that are not derived from exosomes. These dyes can also change the functional properties of exosomes while increasing the background imaging.1,2
The dyes used in ExoSparkler series (Mem Dye-Green, Red, and Deep Red) do not cause aggregation and have little influence on properties of exosomes, allowing a more accurate observation of exosome dynamics.
1) Mehdi Dehghani et al., “Exosome labeling by lipophilic dye PKH26 results in significant increase in vesicle size”.bioRxiv., 2019, doi:10.1101/532028.
2) Pužar Dominkuš P et al., “PKH26 labeling of extracellular vesicles: Characterization and cellular internalization of contaminating PKH26 nanoparticles.” Biochim Biophys Acta Biomembr., 2018, doi: 10.1016/j.bbamem.2018.03.013.
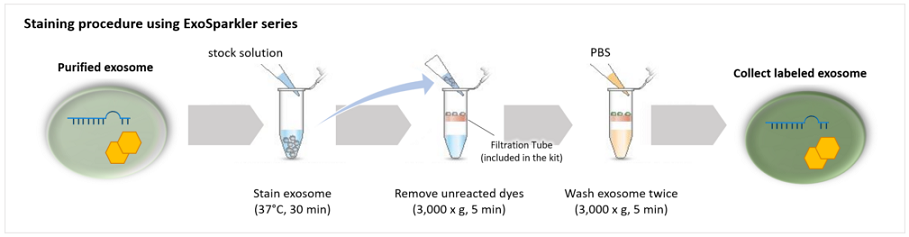
Our ExoSparkler Exosome Membrane Labelling Kits provide everything from fluorescence labeling to purification
ExoSparkler series contains filtration tubes available for the removal of dyes unreacted after fluorescence labeling, as well as an optimized protocol for labeling exosomes. Our ExoSparkler series makes it possible to prepare fluorescence labeling of exosomes using the simple procedure.
Comparison of purification methods (removal of unlabeled dyes)
The filtration tubes used to remove unlabeled dyes in this kit can purify exosomes at a higher recovery rate than gel filtration methods.
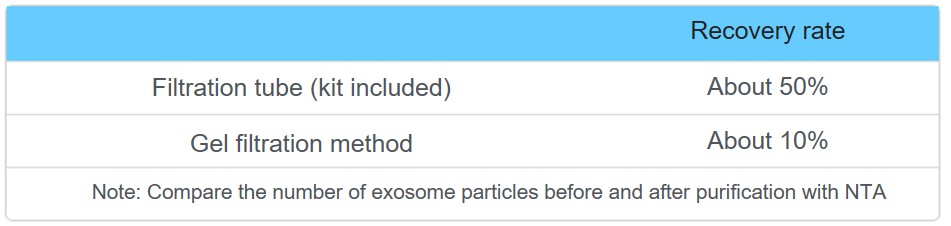
For the effectiveness of purification using filtration tubes, please see Q&A.
(The filter is colored in the purification after the labeling, Have unlabeled dyes been removed?)
Mem Dyes have little effect on exosome properties
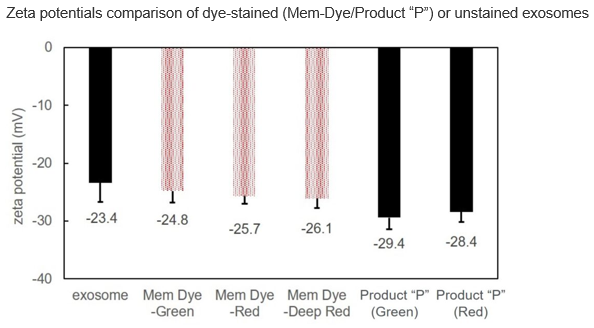
NTA (nanoparticle tracking analysis) and zeta potential were measured to determine the changes in exosomes of dye-stained with Mem Dye-Deep Red or Product “P” (green or red) or unstained exosomes.
As a result, the Mem-Dye series (green, red, deep red) had little effect on exosome properties.
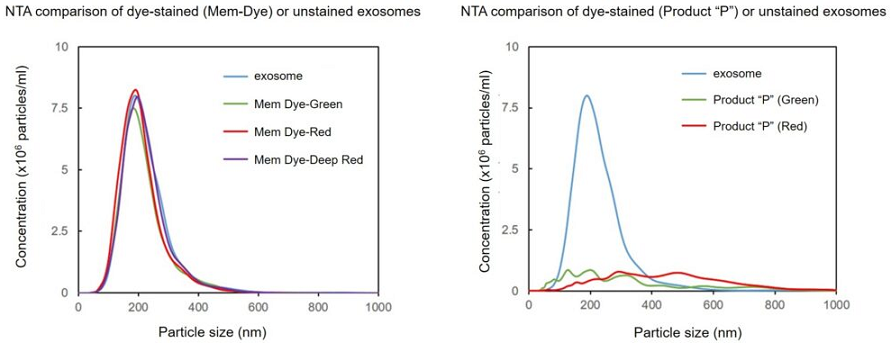
Effect of the dyes on the particle size of the exosomes
Exosomes were stained with Mem Dye-series (green, red, deep red) and Product “P” (green and red) at a dye concentration of 10 μmol/L in DMSO, the NTA (nanoparticle tracking analysis) of the stained exosomes (as 10 µg protein) was measured.
As a result, Mem Dyes-series did not change number and particle size of the exosomes (bottom left). Conversely, the Product “P” stained exosomes showed the significant changes of particle size and population of the exosomes (bottom right).
Instrument: LM10-HSBFT 14 (Nanosight)
Effect of the dyes on the zeta potentials of the exosomes
Exosomes were stained with Mem Dye-series (green, red, crimson) and Product “P” (green and red) at a dye concentration of 10 μmol/L in DMSO, the zeta potentials of the stained exosomes (as 10 µg protein) was measured.
As a result, product “P”-stained exosomes have lower zeta potential than Mem Dye-stained.
Instrument: Zetasizer Nano ZSP (Malvern Panalytical)
Observethetime-dependent changes in exosome localization
Exosomes purified by ultracentrifugation (10 µg as protein amount) were stained with Mem Dye-Deep Red (Exosome Membrane Fluorescence Labeling Kit) and added to HeLa cells (1.25×10⁴ cells) stained with lysosome staining dye. The fluorescence images were observed after 1 h and 4 h incubation.
As a result, it was confirmed that the fluorescence puncta (purple) of Mem Dye-Deep Red overlapped with the localization of lysosomes (green) over time (white), and that the localization of exosomes changed in a time-dependent manner.
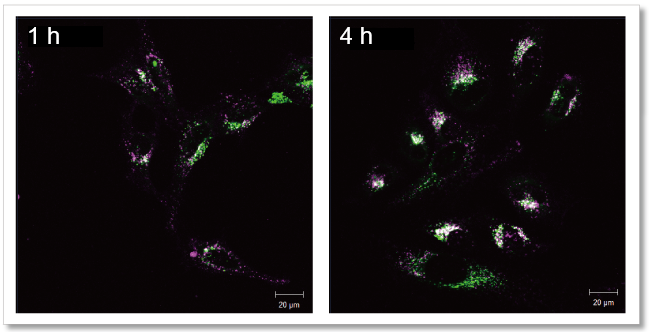
Detection Conditions
Mem Dye-Deep Red (Purple): Ex 640 nm/Em 640-760 nm
Lysosome staining dye: Ex 488 nm/Em 490-540 nm
| Product | Size | Product Code |
|---|---|---|
| Visualization of Exosome | Exosome Membrane Fluorescence Labeling Kits | |
| ExoSparkler Exosome Membrane Labeling Kit-Green | 5 samples | EX01-10 |
| ExoSparkler Exosome Membrane Labeling Kit-Red | 5 samples | EX02-10 |
| ExExoSparkler Exosome Membrane Labeling Kit-Deep Red | 5 samples | EX03-10 |
| Exosome Protein Fluorescence Labeling Kits | ||
| ExoSparkler Exosome Protein Labeling Kit-Green | 5 samples | EX04-10 |
| ExoSparkler Exosome Protein Labeling Kit-Red | 5 samples | EX05-10 |
| ExoSparkler Exosome Protein Labeling Kit-Deep Red | 5 samples | EX06-10 |
|
Note: Protein amount : 1-10μg/ sample, Particle count : 10 to 100 x 108 /samples (As purified exosome using ultracentrifugation) |
||
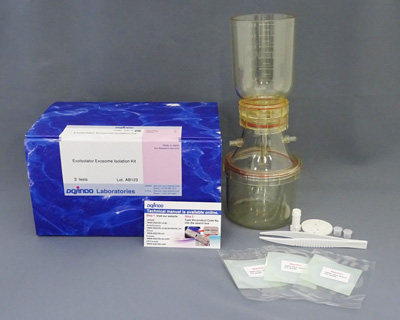
ExoIsolator Exosome Isolation Kit
~ Features ~
- Easy to use, no technique required
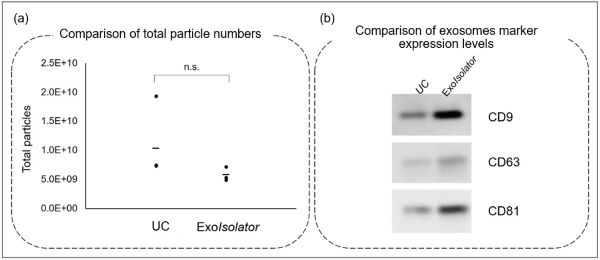
- Recovery rate equivalent to ultracentrifugation
- Filter holder is reusable
Easy to use no technique required
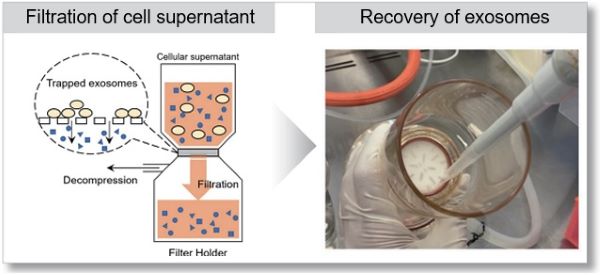
Recovery rate equivalent to ultracentrifugation
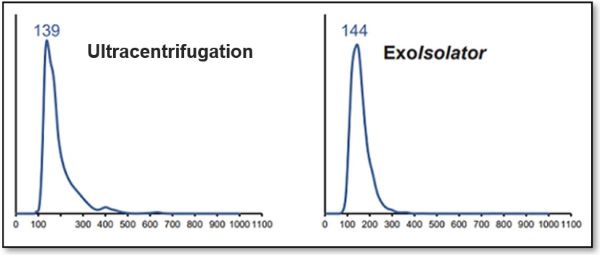
(a) Nanoparticle number and (b) expression level of exosome markers
| Product | Size | Product Code |
|---|---|---|
| ExoIsolator Exosome Isolation Kit | 3 tests | EX10-10 |
| Filter for exosome isolation kit | 10 pieces | EX11-10 |
*ExoIsolator Exosome Isolation Kit contains Filter Holder x 1, Isolation Filter x 3, Tweezers x 1. The Filter Holder can be reused after autoclaving.