 Hidden sections will not be printed.
Kit Contents
- 100 tests
Oxygen Probe 110 μl x 1 Mineral Oil 10 ml x 1
- 300 tests
Oxygen Probe 110 μl x 3 Mineral Oil 10 ml x 3
Storage Conditions
Store at -20 oC
Required Equipment and Materials
- Microplate reader with temperature control
- 96-well black clear-bottom microplate
- 20-200 μl multichannel pipette
- 100-1000 μl, 20-200 μl and 2-20 μl micropipettes
- 1.5 ml microtube
- Conical tube
- Heating block or water bath
- FCCP(Carbonyl cyanide 4-(trifluoromethoxy)phenylhydrazone)
General Information
Oxygen is consumed mainly in the process of adenosine triphosphate (ATP) production by mitochondrial oxidative phosphorylation. Therefore, the oxygen consumption rate (OCR) of cells is an indicator of mitochondrial function. Cancer cells produce ATP using glycolysis, which is less efficient than oxidative phosphorylation. In immune cells, predominance of oxidative phosphorylation inhibits anti-tumor effects, whereas predominance of the glycolytic system promotes anti-tumor effects. The OCR of cells can be measured as an indicator of their energy metabolism.
The Extracellular OCR Plate Assay Kit enables measurement of the OCR of cultured cells. The kit includes an Oxygen Probe, which increases phosphorescence intensity when the oxygen concentration in the medium decreases, and Mineral Oil to block the influx of oxygen from the air. The kit does not require any special equipment, media, or plates and can be used with a general-purpose fluorescence microplate reader and microplates.
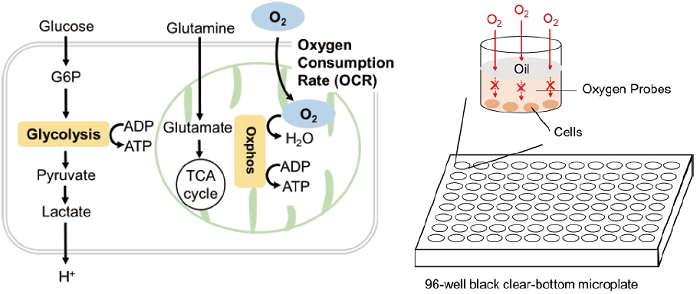
Figure 1. Principle of Extracellular OCR Plate Assay Kit
Precautions
- Equilibrate reagents to room temperature prior to use.
- Briefly centrifuge the Oxygen Probe tube before opening it to remove all content from the walls of the tube and the inside of the cap.
- Analysis of samples in triplicate is recommended for accuracy.
- Set the microplate reader temperature at 37 oC before measurement.
- Pre-warm the Mineral Oil and sample solutions to around 37 oC in a heating block or water bath.
- When using a 96-well microplate, prepare several different cell densities for the experiment and determine the optimal cell density using the example below.
e.g., Suspension cells: 400,000 cells/well
Adherent cells: 50,000 cells/well
For more information see experimental example ②: Determination of the optimal density of HEK293 cells.
Preparation of Solutions
Preparation of a working solution
- Note: Please use the serum-containing medium in the experiment.
- Add medium to a conical tube.
- Add Oxygen Probe to the medium (see Table 1).
- Note: The working solution is light-sensitive. Prepare the solution just before use and protect it from light by covering it with aluminum foil. Please use up the working solution within that day.
| 15 wells | 30 wells | 45 wells | 60 wells | 75 wells | 90 wells | |
| Oxygen Probe | 16.5 μl | 33 μl | 49.5 μl | 66 μl | 82.5 μl | 99 μl |
| Medium | 1483.5 μl | 2967 μl | 4450.5 μl | 5934 μl | 7417.5 μl | 8901 μl |
General Protocol
- Preliminary Experiment (Optimization of cell density) -
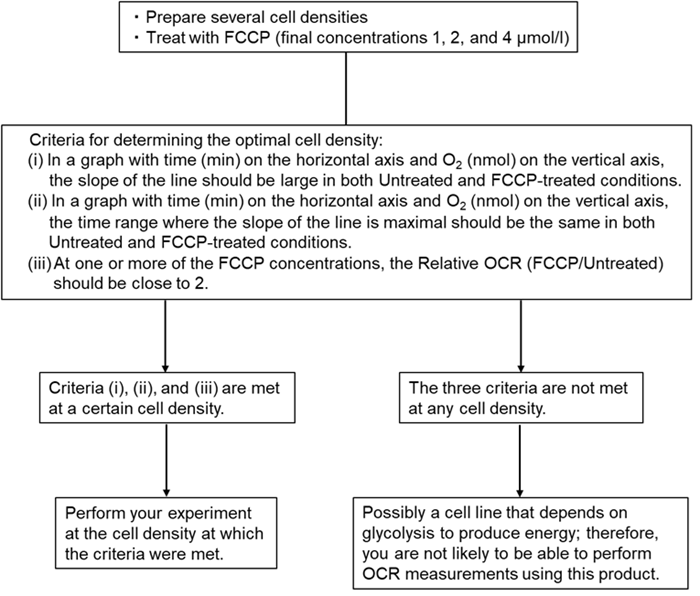
When using a 96-well microplate, prepare several different cell densities for the experiment and determine the optimal cell density using the example below.
e.g., Suspension cells: 400,000 cells/well
Adherent cells: 50,000 cells/well
For more information see experimental example ②: Determination of the optimal density of HEK293 cells.
 |
|
Figure 2. Experimental flowchart |
- Experiment -
〈Suspension cells〉
When testing sample type or concentration in the same cell line and the cell density.
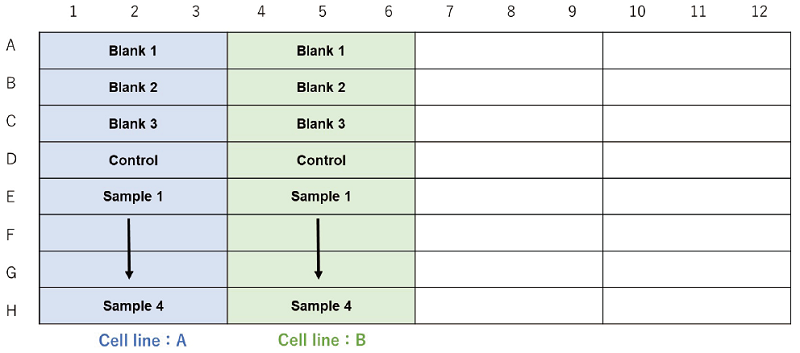
When testing different cell lines.
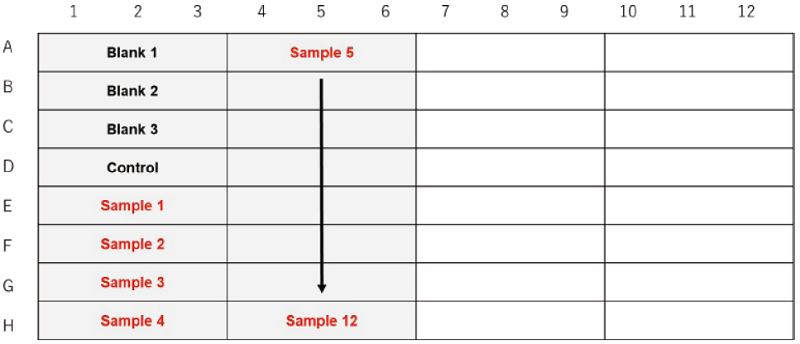
When testing different cell densities.
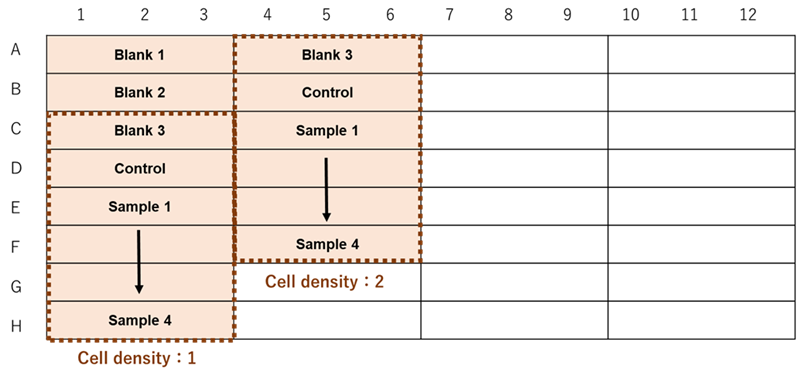
Figure 3. Example assay plate formats (n=3)
| Blank 1 | Blank 2 | Blank 3 | Control | Sample | |
| Medium | 110 μl | 10 μl | 10 μl | 10 μl | - |
| working solution | - | 100 μl | - | - | - |
| Cells (suspended in medium) | - | - | 100 μl | - | - |
| Cells (suspended in working solution) | - | - | - | 100 μl | 100 μl |
| Sample solution | - | - | - | - | 10 μl |
| Mineral Oil | 1 drop | 1 drop | 1 drop | 1 drop | 1 drop |
- Please use the serum-containing medium in the experiment.
- Suspend cells (the optimal cell density determined by the preliminary experiment) in the medium for Blank 3 and in working solution for the Control and Samples (see Table 2). Seed them (100 μl) in a 96-well black clear-bottom microplate (see Figure 3).
- Triplicate measurements are recommended to obtain accurate data.
- Add 100 μl of medium to Blank 1 and 100 μl of working solution to Blank 2 (see Figure 3).
- Incubate the microplate for 30 minutes in a microplate reader (37 oC).
- Add 10 μl of medium to Blank 1, Blank 2, Blank 3, and the Control (see Figure 3).
- Pre-warm the medium to around 37 oC in a heating block or water bath.
- Dilute a sample with a medium and add 10 μl to the Samples (see Figure 3).
- Pre-warm the diluted sample solution to around 37 oC in a heating block or water bath.
- Immediately after adding the sample solution, add 1 drop of Mineral Oil to all wells.
- Pre-warm Mineral Oil to around 37 oC in a heating block or water bath.
- Incubate the microplate for 5 minutes in the microplate reader (37 oC).
- Measure the kinetics using the microplate reader (recommended filter settings: Ex: 500 nm, Em: 650 nm, 10-min interval for 200 min, Bottom reading).
- Calculate the OCR from the intensity using the calculation sheet downloaded from the E297 product page.
〈Adherent cells〉
When testing sample type or concentration in the same cell line and the cell density.
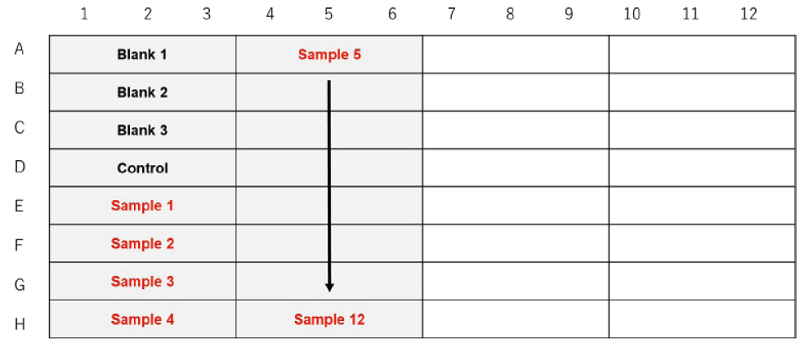
When testing different cell lines.
When testing different cell densities.
Figure 4. Example assay plate formats (n=3)
| Blank 1 | Blank 2 | Blank 3 | Control | Sample | |
| Medium | 110 μl | 10 μl | 110 μl | 10 μl | - |
| working solution | - | 100 μl | - | 100 μl | 100 μl |
| Sample solution | - | - | - | - | 10 μl |
| Mineral Oil | 1 drop | 1 drop | 1 drop | 1 drop | 1 drop |
- Please use the serum-containing medium in the experiment.
- Seed cell suspension 100 μl (the optimal cell density determined by the preliminary experiment) in a 96-well black clear-bottom microplate for Blank 3, the Control, and Samples (see Figure 4).
- Triplicate measurements are recommended to obtain accurate data.
- If the normalization of the cell density per well using nuclear staining (Hoechst 33342) is needed after the OCR measurement, please seed cells to the calibration wells. Please refer to the Q&A section about the example for adherent cells on website.
- Culture overnight in an incubator (37 oC, 5% CO2).
- Remove the medium from the wells, taking care not to peel off the cells.
- Add 100 μl of medium to Blank 1 and Blank 3, and 100 μl of working solution to Blank 2, the Control, and Samples (see Figure 4).
- Incubate the microplate for 30 minutes in a microplate reader (37 oC).
- Add 10 μl of medium to Blank 1, Blank 2, Blank 3, and the Control (see Figure 4).
- Pre-warm the medium to around 37 oC in a heating block or water bath.
- Dilute a sample with a medium and add 10 μl to the Samples (see Figure 4).
- Pre-warm the diluted sample solution to around 37 oC in a heating block or water bath.
- Immediately after adding the sample solution, add 1 drop of Mineral Oil to all wells.
- Pre-warm Mineral Oil to around 37 oC in a heating block or water bath.
- Incubate the microplate for 5 minutes in the microplate reader (37 oC).
- Measure the kinetics using the microplate reader (recommended filter settings: Ex: 500 nm, Em: 650 nm, 10-min interval for 200 min, Bottom reading).
- Calculate the OCR from the intensity using the calculation sheet downloaded from the E297 product page.
Analysis
- This calculation sheet is based on the experimental conditions as described in this product manual (i.e., well conditions, temperature, and liquid volume).
- Calculate the average value of intensity for each well condition at each time point of the measured data. Enter them in the corresponding orange cells in the downloaded calculation sheet (rows 3-34).

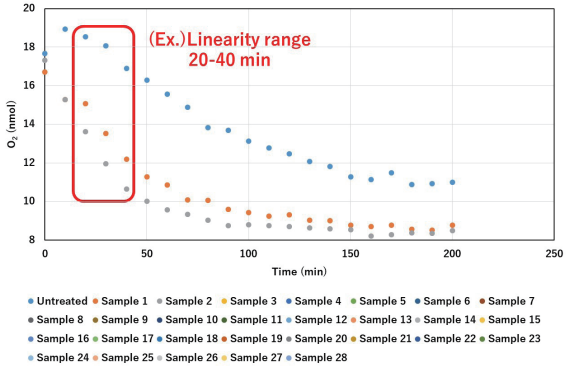
- From the visual graph data, determine a signal shared range of times that best describes linearity for as many well conditions as possible.
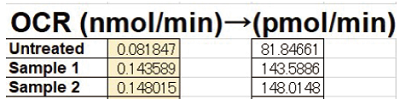
- Using the O2 (nmol) and times (min) within the time range selected in step 2, calculate the OCR (nmol/min) per well. The example below uses the 20-40-minute range (cells D70 to F70).
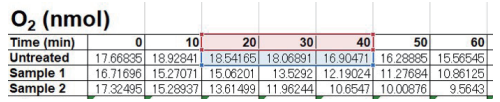
Enter the following formula in the orange boxes below,
“= -SLOPE(“known y”, “known x”)"- known y: Range of O2 (nmol) over which linearity is obtained.
known x: Range of time (min) over which linearity is obtained.
Untreated: “= -SLOPE(D71:F71,D70:F70)”
Sample 1: “= -SLOPE(D72:F72, D70:F70)”
- known y: Range of O2 (nmol) over which linearity is obtained.
- When the formula above is entered, the units for OCR will automatically be converted from nmol/min to pmol/min in the adjacent column.
- If you need the OCR normalized by cell density, perform a hemocytometer analysis or nuclear staining.
Experimental Example ①
Changes in OCR in HepG2 cells on treatment with mitochondrial uncoupler FCCP.
- HepG2 cells (5.0x10⁵ cells/ml) were diluted in medium (DMEM containing 10% fetal bovine serum and 1% penicillin-streptomycin) and seeded in a 96-well black clear-bottom microplate (5.0x10⁴ cells/well).
- The cells were cultured overnight in an incubator (37 oC, 5% CO2).
- The medium was removed from the wells.
- DMEM containing 10% FBS (100 μl/well) or working solution (100 μl/well) was added to each well of the 96-well black clear-bottom microplate.
- The microplate was incubated at 37 oC for 30 minutes in a microplate reader.
- Blank 1, Blank 2, Blank 3, Control: DMEM containing 10% FBS (10 μl/well) and Sample: FCCP diluted in DMEM containing 10% FBS (10 μl/well) was added to the wells.
- Mineral Oil (1 drop) was added to all wells.
- The microplate was incubated at 37 oC for 5 minutes in the microplate reader.
- Kinetics were measured using the microplate reader (Ex: 500 nm, Em: 650 nm, 10-min interval for 200 min, Bottom reading).
- OCR was calculated from intensity using the downloaded calculation sheet.
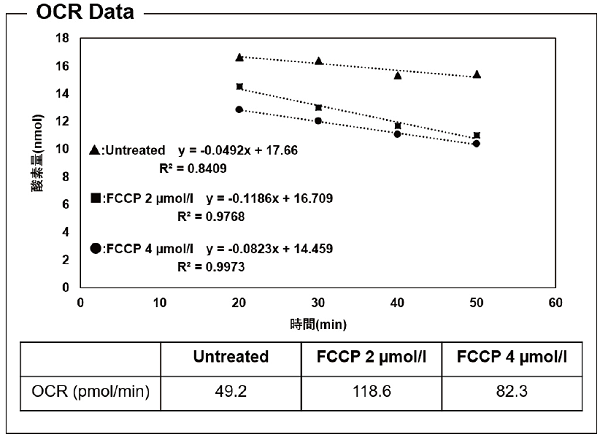
Figure 5. The OCR was increased by 2 μmol/l FCCP treatment compared with untreated cells
and then decreased by treatment with 4 μmol/l FCCP compared with 2 μmol/l FCCP.
Experimental Example ②
Determination of the optimal density of HEK293 cells.
- HEK293 cells (5.0x10⁵ cells/ml, 7.0x10⁵ cells/ml, 2.0x10⁶ cells/ml ) were diluted in medium (MEM containing 10% fetal bovine serum and 1% penicillin-streptomycin) and seeded in a 96-well black clear-bottom microplate (see Figure 6).
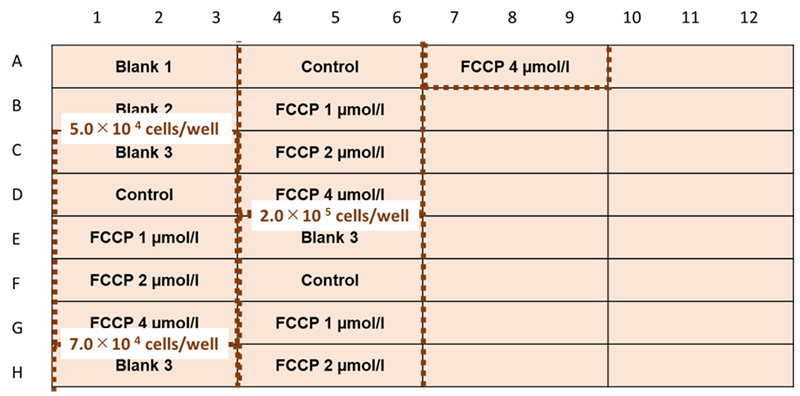
Figure 6. Example assay plate formats (n=3)
- The cells were cultured overnight in an incubator (37 oC, 5% CO2).
- The medium was removed from the wells.
- MEM containing 10% FBS (100 μl/well) or working solution (100 μl/well) was added to each well of the 96-well black clear-bottom microplate.
- The microplate was incubated at 37 oC for 30 minutes in a microplate reader.
- Blank 1, Blank 2, Blank 3, Control: MEM containing 10% FBS (10 μl/well) and FCCP 1 µmol/l, FCCP 2 µmol/l, FCCP 4 µmol/l: FCCP diluted in MEM containing 10% FBS (10 µl/well) was added to the wells.
- Mineral Oil (1 drop) was added to all wells.
- The microplate was incubated at 37 oC for 5 minutes in the microplate reader.
- Kinetics were measured using the microplate reader (Ex: 500 nm, Em: 650 nm, 10-min interval for 200 min, Bottom reading).
- OCR was calculated from intensity using the downloaded calculation sheet.
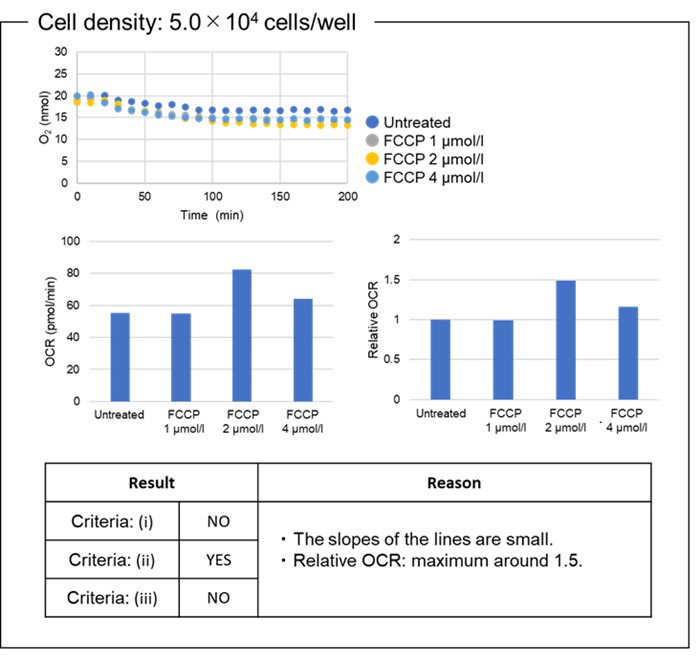
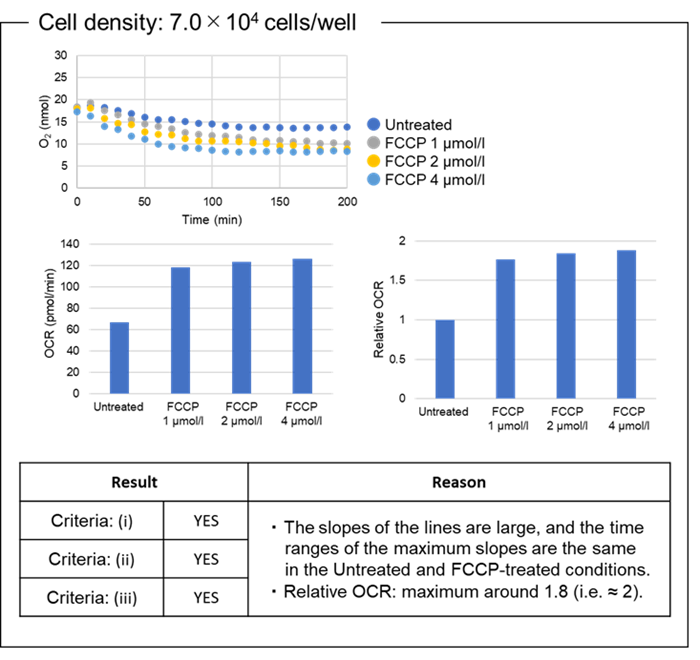
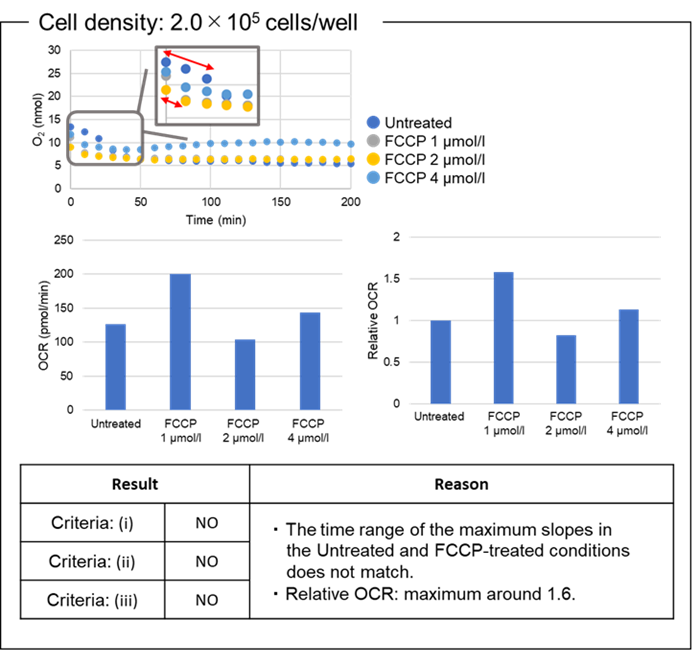
Figure 7. OCR values at different cell densities.
The optimal density of HEK293 cells was 7.0×10⁴ cells/well.
Frequently Asked Questions / Reference


E297: Extracellular OCR Plate Assay Kit
Revised Mar., 12, 2026