 Hidden sections will not be printed.
General Information
Liquid-liquid phase separation (LLPS) is a phenomenon where two liquids with different compositions do not mix and instead separate into two distinct phases. Although this phenomenon has been well-known in physical chemistry for a long time, it has only recently been observed in living organisms, bringing an important new perspective to various biological processes.
To understand phase separation in living organisms, researchers observe phase-separated droplets in cell-free in vitro systems using purified proteins. However, even proteins that form phase-separated droplets may not do so at certain pH values or salt concentrations. Therefore it is essential to examine of the conditions required for droplet formation. This examination not only verifies whether a protein forms droplets under biochemical conditions but also provides insights into the mechanisms by which droplets are formed. Incidentally, the reduced molecular crowding in extracellular systems compared with intracellular environments can make formation more challenging for droplets. In such cases, adding high-molecular-weight compounds such as PEG as crowding agents can mimic the intracellular crowded environment, thereby facilitating droplet formation.
This kit is a set of crowding agents, buffers, and salts for investigating the conditions required to form phase-separated droplets. By following the protocol provided in this kit, you can determine the phase separation conditions suitable for your proteins and nucleic acids.
- This kit is designed to investigate the conditions for forming phase-separated droplets with your proteins. Therefore, standard proteins and other controls are not included in this kit.
Kit Contents
Crowding agents
| PEG400 | 15 g x 1 |
| PEG4000 | 15 g x 1 |
| PEG8000 | 15 g x 1 |
- PEG4000 has a melting point of 52-61°C and may melt and solidify. However, this does not affect the quality of its components. Even in its solid state, its performance as a crowding agent is not affected. Please use a spatula to scrape it as needed.
Buffers
| 500 mmol/l MES Buffer Solution pH 5.5 | 10 ml x 1 |
| 500 mmol/l MES Buffer Solution pH 7.0 | 10 ml x 1 |
| 500 mmol/l Phosphate Buffer Solution pH 6.0 | 10 ml x 1 |
| 500 mmol/l Phosphate Buffer Solution pH 7.5 | 10 ml x 1 |
| 500 mmol/l HEPES Buffer Solution pH 7.0 | 10 ml x 1 |
| 500 mmol/l HEPES Buffer Solution pH 8.0 | 10 ml x 1 |
| 500 mmol/l Tris-HCl Buffer Solution pH 7.0 | 10 ml x 1 |
| 500 mmol/l Tris-HCl Buffer Solution pH 9.0 | 10 ml x 1 |
Salts
| 2 mol/l Sodium Chloride Solution | 20 ml x 1 |
| 2 mol/l Potassium Chloride Solution | 20 ml x 1 |
| 2 mol/l Ammonium Sulfate Solution | 20 ml x 1 |
Storage Condition
Store at 0–5 °C
- PEG400 is hygroscopic. Ensure the lid is closed after use and store it with silica gel. If repeated openings are necessary, pre-divide it into smaller portions for storage.
Required Equipment and Materials
- Target protein, DNA, RNA, etc.
- Electronic balance
- Micropipette
- Microtube
- Conical tube
- Vortex mixer
- Microplate
- Plate reader
- Microscope
General Protocol
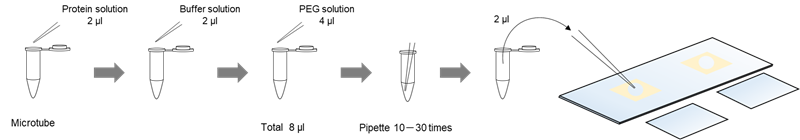
There are several methods for making and observing phase-separated droplets. Here, we introduce methods using 96-well plates and slide glasses.
Observation Using 96-well Microplate
For observation with 96-well plates, detailed procedures can be found in the Experimental Example.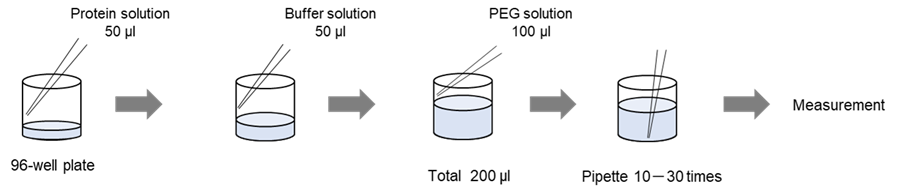
Solution preparation example
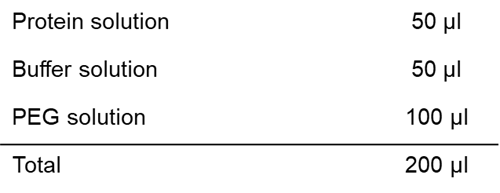
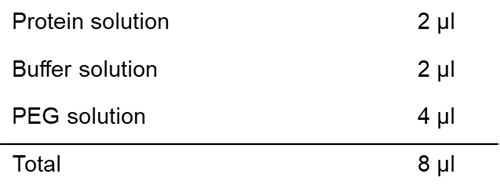
Observation Using slide glasses
For observation with slide glasses, detailed procedures can be found in the (LL01) LLPS Starter Kit.
Solution preparation example
Usage notes
- The number of pipetting actions can affect phase-separated droplet formation. Ensure consistency in the number of pipetting actions for each procedure.
- The number of phase-separated droplets may increase or decrease depending on the temperature. Maintain a consistent room temperature for each experiment. The experiments described in this manual were conducted at room temperatures between 20–25 °C.
- The time required for phase-separated droplets to be formed after solution preparation depends on the experimental conditions. Generally, allow 10 minutes to 24 hours for formation.
- Depending on the sample type, droplets may spread and wet the bottom of the slide glass or plate, making it difficult to observe spherical droplets. If wetting occurs, consider applying a coating to enable observation of spherical droplets. Alternatively, observe droplets that are not in contact with the bottom surface.
Experimental Example
BSA (bovine serum albumin) is used as the protein of interest, and experiments are conducted sequentially evaluating protein concentration, PEG concentration, type and pH of buffer solution, and type and concentration of salt using this kit. The experiments are using a 96-well microplate.
Experimental Example 1
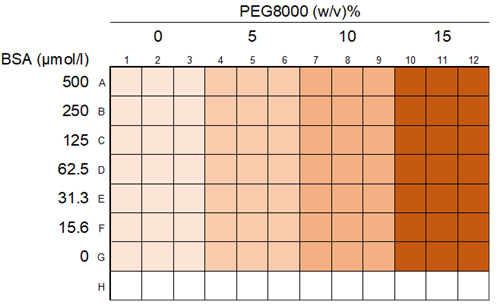
Investigation of Droplets Forming Concentration of BSA Using Crowding Agent PEG8000
The concentration of BSA and the crowding agent were examined. PEG8000 was used as the crowding agent. The other conditions were set to 150 mmol/l NaCl and 50 mmol/l HEPES buffer (pH 7.4) (all at final concentrations).
- Generally, the crowding effect of PEG increases with its molecular weight. We recommend starting with PEG8000 at concentrations of 0–20% (all at final concentrations). If you wish to examine the effects of different molecular weights or use PEG with a lower crowding effect, please use PEG4000 or PEG400.
- The protein concentration at which the droplets are formed varies depending on the properties of the protein. In the experimental example, BSA concentration was examined at 0–500 µmol/l, but some proteins may form droplets even at concentrations of a few µmol/l. Consider 1–1000 µmol/l as a general range for protein concentration.
- When examining higher concentrations of protein or PEG, it requires careful attention to pH variations. If you want to check whether it is at the targeted pH, measure with the plate or seperately prepared solution.
 |
|
| Fig. 1 Layout of Experimental Example 1 |
Preparation of PEG8000 solution
- Seven point five (7.5) g of PEG8000 was weighed out and dissolved in double-deionized H2O (ddH2O). The volume was adjusted to 25 ml to prepare a 30 w/v% PEG8000 solution.
- PEG8000 solutions of 0–30% were prepared by dilution with ddH2O according to the table below.
| Concentration (w/v%) | 30% PEG solution (µl) | ddH2O (µl) | Final concentration (w/v%) |
| 30 | 3000 | 0 | 15 |
| 20 | 2000 | 1000 | 10 |
| 10 | 1000 | 2000 | 5 |
| 0 | 0 | 3000 | 0 |
Preparation of Buffer solution
According to the table below, a 500 mmol/l HEPES buffer solution (pH 7.4) was prepared.
| 500 mmol/l HEPES Buffer Solution pH 7.0 |
500 mmol/l HEPES Buffer Solution pH 8.0 |
Total | |
| Amount | 1100 μl | 900 μl | 2000 μl |
Preparation and dilution series of BSA solution
- The 2000 μmol/l BSA aqueous solution was prepared.
- BSA were purchaced from Sigma-Aldrich.
- In this experiment, ddH2O was used to dissolve BSA. If your protein contains salts, please performe dialysis as needed before use.
- Fifty (50) μl of ddH2O was added to each well in rows B to G of a 96-well plate (IWAKI, 5882-096).
- Fifty (50) μl of 2000 μmol/l BSA was added to rows A and B.
- The solutions were serially diluted from rows B to F (with 50 μl removed from row F), preparing diluted solutions of BSA ranging from 0 to 2000 μmol/l.
- Manual pipetting is strongly recommended to avoid foaming that tend to occur with electric pipettes.
Preparation, observation, and measurement of BSA phase-separation solution
- Twenty (20) µl of 500 mmol/l HEPES buffer solution (pH 7.4) was added to each well.
- Fifteen (15) µl of 2 mol/l Sodium Chloride Solution was added to each well.
- Fifteen (15) µl of ddH2O was added to each well.
- One hundred (100) µl of 0-30% PEG8000 solution was added to each well, and 20 pipetting cycles were performed for each well.
- Because of its high viscosity, the PEG8000 solution should be added slowly using reverse pipetting.
- Manual pipetting is strongly recommended to avoid foaming that tend to occur with electric pipettes.
- After adding the PEG solution, promptly pipette to prevent protein aggregation if left standing for an extended period.
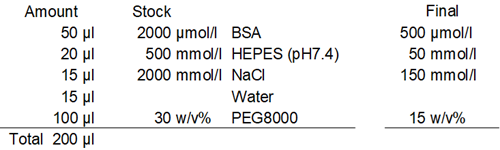
- The samples were incubated at room temperature for 1 hour; after incubation, the turbidity was measured using a plate reader, and the solution was observed under a microscope. The droplet formation (Turbidity) measurements were conducted at 600 nm absorbance.
 |
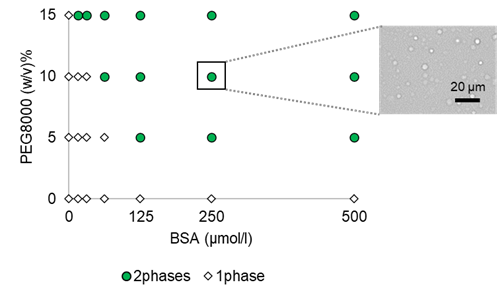 |
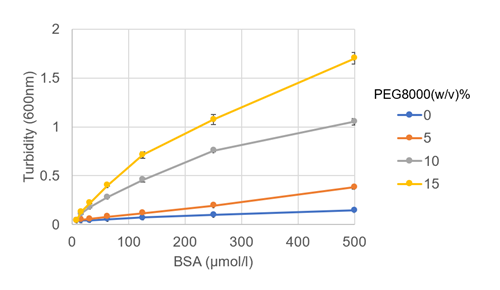
| Fig. 2 Turbidity versus BSA and PEG8000 concentration | Fig. 3 Phase diagram of BSA and microscopic images |
Experimental Example 2
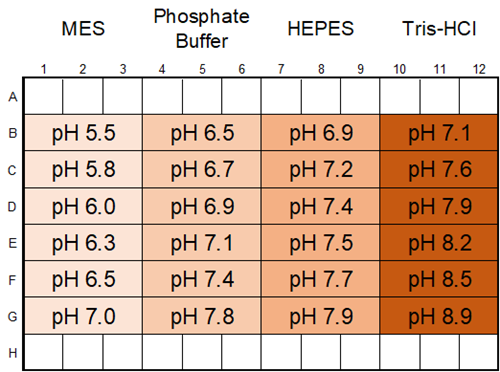
Investigation of buffer type and the effect of pH
Based on the results of Experimental Example 1, the type and pH of the buffer solution were examined. In this experiment, the BSA concentration was 100 μmol/l, the crowding agent was 15% PEG8000, and the salt concentration was 150 mmol/l NaCl.
 |
|
| Fig. 4 Layout of Experimental Example 2 |
Preparation of PEG8000 solution
The 30% PEG8000 solution was prepared as described in Experimental Example 1.
Preparation of buffers at various pH values
Each buffer solution was prepared according to the table below.
| Addition row | Mixing ratio |
Each 500 mmol/l buffer solution (MES pH 5.5 Phosphate buffer pH 6.0 HEPES pH 7.0 Tris-HCl pH 7.0) |
Each 500 mmol/l buffer solution (MES pH 7.0 Phosphate buffer pH 7.5 HEPES pH 8.0 Tris-HCl pH 9.0) |
| B | 10:0 | 100 µl | 0 µl |
| C | 8:2 | 80 µl | 20 µl |
| D | 6:4 | 60 µl | 40 µl |
| E | 4:6 | 40 µl | 60 µl |
| F | 2:8 | 20 µl | 80 µl |
| G | 0:10 | 0 µl | 100 µl |
Preparation of BSA solution
The 400 μmol/l BSA aqueous solution was prepared.
- BSA were purchaced from Sigma-Aldrich.
- In this experiment, ddH2O was used to dissolve BSA. If your protein contains salts, please performe dialysis as needed before use.
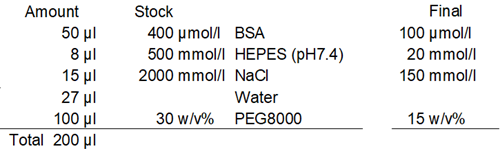
Preparation and observation of the BSA phase-separation solution
- Eight (8) µl of 500 mmol/l buffer solution was added to each well of a 96-well plate (IWAKI, 5882-096).
- Fifteen (15) µl of 2 mol/l Sodium Chloride Solution and 27 µl of ddH2O were added to each well.
- Fifty (50) µl of 400 µmol/l BSA aqueous solution was added to each well.
- One hundred (100) µl of 30% PEG8000 solution was added to each well, and 20 pipetting cycles were performed for each well.
- Because of its high viscosity, the PEG8000 solution should be added slowly using reverse pipetting.
- Manual pipetting is strongly recommended to avoid foaming that tend to occur with electric pipettes.
- After adding the PEG solution, promptly pipette to prevent protein aggregation.
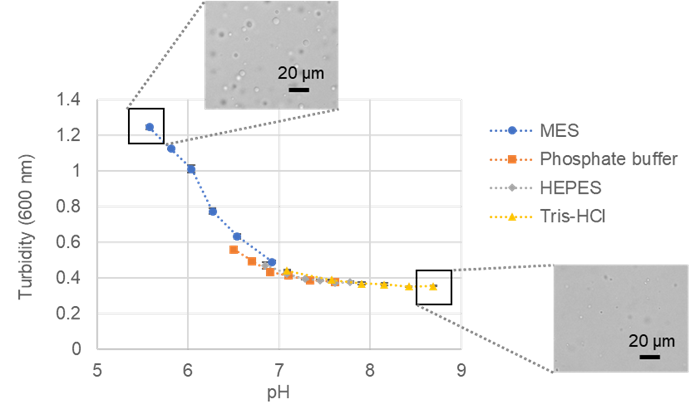
- The samples were incubated at room temperature for 1 hour; after incubation, the turbidity was measured using a plate reader, and the solution was observed under a microscope. Turbidity was measured at 600 nm absorbance.
- The pH of the samples was measured using a pH meter.
 |
|
Fig. 5 Turbidity versus pH of BSA and microscopic images |
All conditions exhibited droplet formation, with lower pH resulting in increased phase-separated droplets.
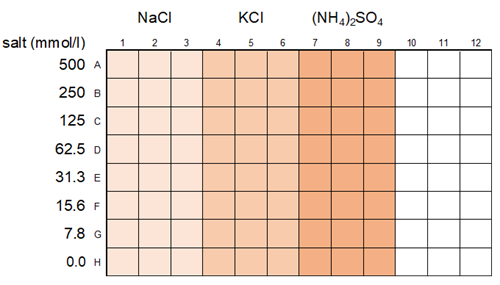
Experimental Example 3
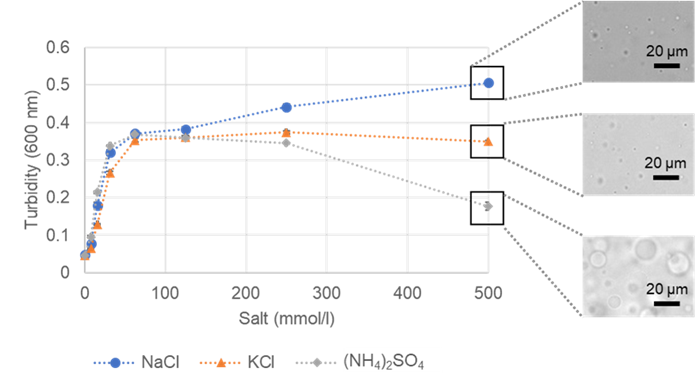
Investigation of the effect of salt
The influence of salt on BSA phase-separation droplet formation was investigated. The BSA concentration was 100 μmol/l, the crowding agent was 15% PEG8000, and the buffer was 20 mmol/l HEPES buffer (pH 7.4) (all final concentrations).
 |
|
| Fig. 6 Layout of Experimental Example 3 |
Preparation of PEG8000 solution
The 30% PEG8000 solution was prepared as described in Experimental Example 1.
Preparation of Buffer Solution
According to the table below, a 500 mmol/l HEPES buffer solution (pH 7.4) was prepared.
| 500 mmol/l HEPES Buffer Solution pH 7.0 |
500 mmol/l HEPES Buffer Solution pH 8.0 |
Total | |
| Amount | 1100 μl | 900 μl | 2000 μl |
Preparation and dilution series of BSA solution
The 800 μmol/l BSA aqueous solution was prepared.
- BSA were purchaced from Sigma-Aldrich.
- In this experiment, ddH2O was used to dissolve BSA. If your protein contains salts, please performe dialysis as needed before use.
Preparation of Salt Dilution Series
- Fifty (50) μl of ddH2O was added to rows B to H of a 96-well plate (IWAKI, 5882-096).
- Fifty (50) µl of 2 mol/l of NaCl, KCl, or (NH4)2SO4 solution were added to rows A and B.
- The solutions were serially diluted from rows B to G (with 50 µl removed from row G), preparing dilutions ranging from 0 to 500 mmol/l.
Preparation and observation of the BSA phase-separation solution
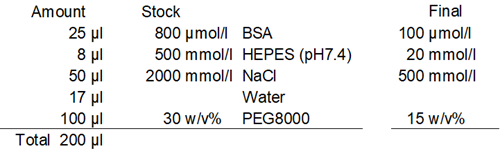
- Eight (8) μl of 500 mmol/l HEPES buffer solution (pH 7.4) and 17 µl of ddH2O were added to each well.
- Twenty-five (25) μl of 800 μmol/l BSA solution was added to each well.
- One hundred (100) μl of 30% PEG8000 solution was added to each well, and the solution was pipetted 20 times for each well.
- Because of its high viscosity, the PEG8000 solution should be added slowly using reverse pipetting.
- Manual pipetting is strongly recommended to avoid foaming that tend to occur with electric pipettes.
- After adding the PEG solution, promptly pipette to prevent protein aggregation if left standing for an extended period.
- The samples were incubated at room temperature for 1 hour; after incubation, the turbidity was measured using a plate reader, and the solution was observed under a microscope. Turbidity was measured at 600 nm absorbance.
 |
|
Fig. 7 Turbidity versus salt concentrations of BSA and microscopic images |
Higher salt concentrations resulted in better formation of BSA phase-separated droplets. The experiment of sodium chloride exhibited higher turbidity and a greater number of droplets. Conversely, the experiment of ammonium sulfate showed lower turbidity but better droplet formation. The droplets were larger, which likely resulted in the lower turbidity values observed.
Appendix [Preparation of buffer solution pH]
The following table shows the approximate pH of mixed buffer solutions at a concentration of 50 mmol/l (10× dilution).
- The pH may vary slightly depending on the dilution factor.
- In phase-separation assays, the pH may fluctuate due to high concentrations of proteins, nucleic acids, or PEG. If you want to check whether it is at the targeted pH, measure the prepared solution.
Table 1 Preparation of 50 mmol/l MES buffer solution at each pH
| 500 mmol/l MES Buffer Solution pH 5.5 |
500 mmol/l MES Buffer Solution pH 7.0 |
ddH2O | pH |
| 100 μl | 0 μl | 900 µl | 5.5 |
| 90 μl | 10 μl | 900 µl | 5.6 |
| 80 μl | 20 μl | 900 µl | 5.8 |
| 70 μl | 30 μl | 900 µl | 5.9 |
| 60 μl | 40 μl | 900 µl | 6.0 |
| 50 μl | 50 μl | 900 µl | 6.1 |
| 40 μl | 60 μl | 900 µl | 6.3 |
| 30 μl | 70 μl | 900 µl | 6.4 |
| 20 μl | 80 μl | 900 µl | 6.5 |
| 10 μl | 90 μl | 900 µl | 6.7 |
| 0 μl | 100 μl | 900 µl |
7.0 |
Table 2 Preparation of 50 mmol/l phosphate buffer solution at each pH
| 500 mmol/l Phosphate Buffer Solution pH 6.0 |
500 mmol/l Phosphate Buffer Solution pH 7.5 |
ddH2O | pH |
| 100 μl | 0 μl | 900 µl | 6.5 |
| 90 μl | 10 μl | 900 µl | 6.6 |
| 80 μl | 20 μl | 900 µl | 6.7 |
| 70 μl | 30 μl | 900 µl | 6.8 |
| 60 μl | 40 μl | 900 µl | 6.9 |
| 50 μl | 50 μl | 900 µl | 7.0 |
| 40 μl | 60 μl | 900 µl | 7.1 |
| 30 μl | 70 μl | 900 µl | 7.3 |
| 20 μl | 80 μl | 900 µl | 7.4 |
| 10 μl | 90 μl | 900 µl | 7.6 |
| 0 μl | 100 μl | 900 µl | 7.8 |
Table 3 Preparation of 50 mmol/l HEPES buffer solution at each pH
| 500 mmol/l HEPES Buffer Solution pH 7.0 |
500 mmol/l HEPES Buffer Solution pH 8.0 |
ddH2O | pH |
| 100 μl | 0 μl | 900 µl | 6.9 |
| 90 μl | 10 μl | 900 µl | 7.1 |
| 80 μl | 20 μl | 900 µl | 7.2 |
| 70 μl | 30 μl | 900 µl | 7.3 |
| 60 μl | 40 μl | 900 µl | 7.4 |
| 50 μl | 50 μl | 900 µl | 7.4 |
| 40 μl | 60 μl | 900 µl | 7.5 |
| 30 μl | 70 μl | 900 µl | 7.6 |
| 20 μl | 80 μl | 900 µl | 7.7 |
| 10 μl | 90 μl | 900 µl | 7.8 |
| 0 μl | 100 μl | 900 µl | 7.9 |
Table 4 Preparation of 50 mmol/l Tris-HCl buffer solution at each pH
| 500 mmol/l Tris-HCl Buffer Solution pH 7.0 |
500 mmol/l Tris-HCl Buffer Solution pH 9.0 |
ddH2O | pH |
| 100 μl | 0 μl | 900 µl | 7.1 |
| 90 μl | 10 μl | 900 µl | 7.4 |
| 80 μl | 20 μl | 900 µl | 7.6 |
| 70 μl | 30 μl | 900 µl | 7.8 |
| 60 μl | 40 μl | 900 µl | 7.9 |
| 50 μl | 50 μl | 900 µl | 8.1 |
| 40 μl | 60 μl | 900 µl | 8.2 |
| 30 μl | 70 μl | 900 µl | 8.4 |
| 20 μl | 80 μl | 900 µl | 8.5 |
| 10 μl | 90 μl | 900 µl | 8.7 |
| 0 μl | 100 μl | 900 µl | 8.9 |
Frequently Asked Questions / Reference


LL02: LLPS Forming Condition Screening Kit
Revised Sep., 02, 2024