 Hidden sections will not be printed.
General Information
For protein concentration determination, several methods are available, such as Lowry method, bicinchoninate method (BCA method), Biuret method, and Bradford method. Coomassie Brilliant Blue G (Fig. 1) has been utilized for quick and sensitive protein detection known as the Bradford method. Coomassie Brilliant Blue G interacts with protein and stains blue under acidic conditions. The maximum change in absorbance by interaction with proteins is at 595 nm (Fig. 2). The staining reaction completes within 1 minute and the color is stable for 30 minutes. Therefore, protein concentration can easily be determined within a few minutes in colorimetric detection. This kit contains ready-to-use Coomassie Brilliant Blue G solution and BSA solution as a protein standard solution, and is suitable for a microplate assay. The protein detection range is from 10 μg/ml to 2,000 μg/ml by a standard method, and is from 1 μg/ml to 50 μg/ml by a micro method. Since the sensitivity of the CBB-based protein assay depends on the types of proteins be used, note the protein-to-protein variation in quantification.
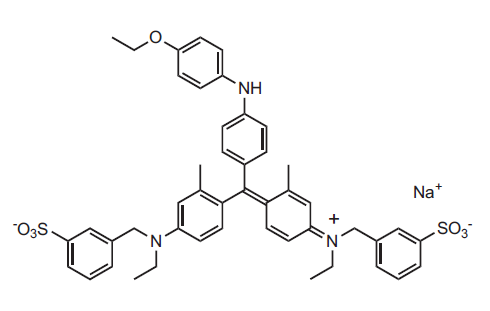
Fig.1 Chemical structure of Coomassie Brilliant Blue G
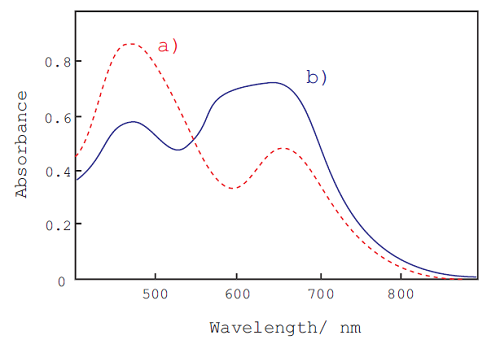
Fig. 2 Absorption spectra of CBB-G with and without protein.
a) protein free, b) protein (BSA): 500 μg/ml
Kit Contents
| 500 tests | CBB solution | 100 ml x 2 |
| Standard BSA solution (4,000 μg/ml) | 1.5 ml x 1 |
| 2500 tests | CBB solution | 1,000 ml x 1 |
| Standard BSA solution (4,000 μg/ml) | 1.5 ml x 2 |
Storage Condition
Store at 0-5oC
- CBB solution is stable for 12 months at 0-5oC and 6 months at room temperature.
Required Equipment and Materials
- Microplate reader (600 nm filter)
- Multi channel pipette
- 96-well microplate
- 1.5 ml tube
- 10 μl, 100-200 μl pipettes
Precaution
This kit contains glass vials. Handle them carefully.
General Protocol
Standard Method
- Dilute Standard BSA solution with multiple dilution to prepare various concentration of Standard BSA solution.
2,000 μg/ml, 1000 μg/ml, 500 μg/ml, 250 μg/ml, 125 μg/ml,63 μg/ml, 32 μg/ml, 0 μg/ml - Add 6 μl of various concentration of Standard BSA solution to each well.
- Add 300 μl CBB solution to each well, and mix.
- Vibrate the plate for 1 minute at room temperature.
- Measure the absorbance of each well at 600 nm with a microplate reader.
- Subtract the absorbance of the blank solution from the absorbance of each well.
- Plot the concentration of BSA on the X-axis and absorbance on the Y-axis to prepare a calibration curve (Fig. 3). Determine protein concentration of unknown sample using the calibration curve.
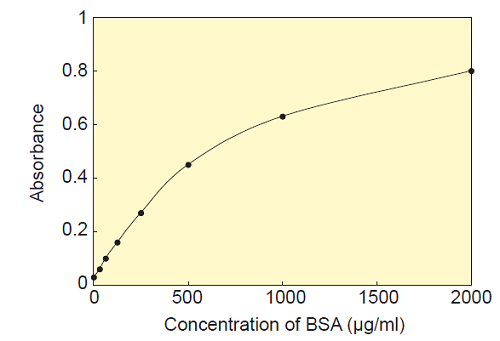
Fig. 3 Typical calibration curve prepared by Standard BSA solution.
Micro Method
Micro method is utilized for purified protein detection.*1
- Dilute Standard BSA solution with multiple dilution to prepare various concentration of Standard BSA solution.
50 μg/ml, 25 μg/ml, 12.5 μg/ml, 6.3 μg/ml, 3.2 μg/ml, 1.6 μg/ml, 0.8 μg/ml, 0 μg/ml - Add 150 μl CBB solution to each well.
- Add 150 μl of various concentration of Standard BSA solution to each well, and mix.
- Vibrate the plate for 1 minute at room temperature.
- Measure the absorbance of each well at 600 nm with a microplate reader.
- Subtract the absorbance of the blank solution from the absorbance of each well.
- Plot the concentration of BSA on the X-axis and absorbance on the Y-axis to prepare a calibration curve. Determine protein concentration of unknown sample using the calibration curve.
*1 Detergents severely interfere with micro assay.
Substances interfere with Standard Method
Certain substances interfere with the protein quantification assay including detergents, organic solvents chelating agents. Other substances may interfere with the assay if the concentration is too high. The maximum compatible concentrations of such substances are indicate in Table1.
|
|
||||||||||||||||||||||||||||||||||||||||||||||||||||||||||||||||||||||||||||||||||||
*2 The compatible concentration was determined within ±5% fluctuation of the slope of the BSA calibration curve.
Protein-to-protein Variation
Standard BSA solution (4,000 μg/ml) is a standard protein to determine the protein concentration in samples. Protein-to-protein variation compared with BSA are shown in Table 2.
-
Table 2 Protein-to-protein variation in quantification Protein Protein vs. BSA*3 BSA 1.00 Chymotrypsinogen A 0.67 Transferrin 1.02 Human IgG 0.96
-
*3 Value was determined by the comparison with the slope of calibration curve.
value=slope of protein/ slope of BSA
Notes
- Since the sensitivity of the CBB-based protein assay depends on the type of proteins be used, note the protein-to-protein variation in quantification (Table 2). For more accurate quantification, use same protein as a standard.
- Since CBB solution is highly acidic, handle with care.
- If a protein concentration in a sample is too high, some proteins may precipitate from the solution mixture with CBB solution. Dilution of the sample solution is required prior to mix with CBB solution if protein concentration is high.
- Confirm that excess amount of interfering materials is contained in the sample solution (see Table 1). If the amount of the interfering material is high, dilute it to reduce the concentration of interfering materials prior to use.
Reference
- M. M. Bradford, Anal. Biochem., 1976, 72, 248.
Frequently Asked Questions / Reference


PQ01: Protein Quantification Kit-Rapid
Revised Dec., 22, 2023