


Lipid Peroxidation Probe -BDP 581/591 C11-

Lipid Peroxidation Assay
- High sensitivity to Lipid Peroxidation
- Applicable to Fluorescent Microscope, Plate Reade, Flow Cytometer
-
Product codeL267 Lipid Peroxidation Probe -BDP 581/591 C11-
| Unit size | Price | Item Code |
|---|---|---|
| 200 tests | $185.00 | L267-10 |
Description
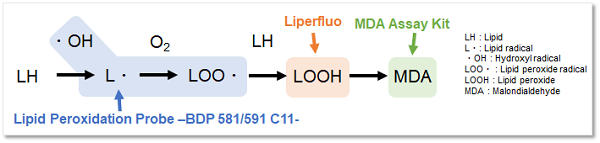
Reactive oxygen species (ROS) are highly reactive chemicals formed from diatomic oxygen (O2). In recent years, it has been reported that ROS reacts with superoxide causing lipid peroxidation, which is associated with cell death and various diseases such as inflammation. As described above, ROS undergoes various mechanisms and therefore, it is important to evaluate the lipid peroxidation level with appropriate reagents.
Lipid Peroxidation Probe -BDP 581/591 C11- is a fluorescent dye used to detect the formation of lipid peroxides. Dojindo Laboratories' (Code: L248) Liperfluo can detect lipid peroxides. Unlike Liperfluo, This fluorescent dye does not respond to lipid peroxides but reacts with lipid radicals formed during lipid peroxidation by reactive oxygen species with high sensitivity. The high sensitivity of this probe enables detection with a plate reader, which is difficult with Liperfluo, making it an excellent reagent for fluorescence quantification and screening applications.
Ferroptosis Analysis Products
| Product Name | Target | Ditection Properties |
|---|---|---|
| FerroOrange | Intracellular Fe2+ | Microscopy, Plate reader Ex: 543 nm / Em: 580 nm |
| Mito-FerroGreen | Mitochondrial Fe2+ | Microscopy Ex: 505 nm / Em: 535 nm |
| Lyso-FerroRed | Lysosomal Fe2+ | Microscopy, FCM, Plate reader Ex: 551 nm / Em: 571 nm |
| Iron Assay Kit -Colorimetric- | Fe2+ and Fe3+ | Plate reader Colorimetric, λ: 593 nm |
| Liperfluo | Lipid Peroxide | Microscopy, FCM Ex: 488 nm / Em: 500-550 nm |
| Lipid Peroxidation Probe -BDP 581/591 C11- |
Lipid Peroxidation Process |
Microscopy, FCM, Plate reader |
| MDA Assay Kit | Malondialdehyde | Plate reader Fluorescence, Ex: 540 nm / Em: 590 nm Colorimetric, λ: 532 nm |
| Cystine Uptake Assay Kit | Cystine uptake | Plate reader Ex: 485 nm / Em: 535 nm |
| GSSG/GSH Quantification Kit | GSSG and GSH | Plate reader Colorimetric, λ: 405 nm |

Manual
Technical info
Lipid Peroxidation Probe -BDP 581/591 C11- is a fluorescent probe for detecting lipid peroxidation. This fluorescent probe does not react with lipid peroxides but reacts with lipid radicals generated when lipids are peroxidized, resulting in the detection of lipid peroxidation. The unreacted probe emits red fluorescence, but after reacting with radicals around lipids, it changes its fluorescence from red to green. Thus, lipid peroxidation can be detected with high sensitivity because it is detected by the ratio of red to green fluorescence intensity.
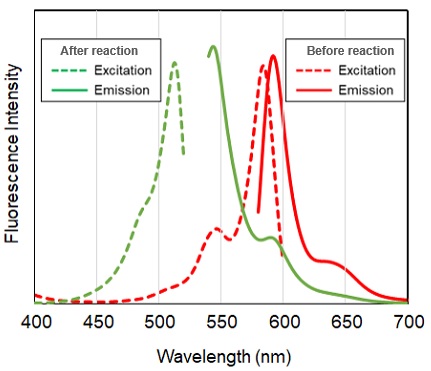
Spectrum of Lipid Peroxidation Probe -BDP 581/591 C11
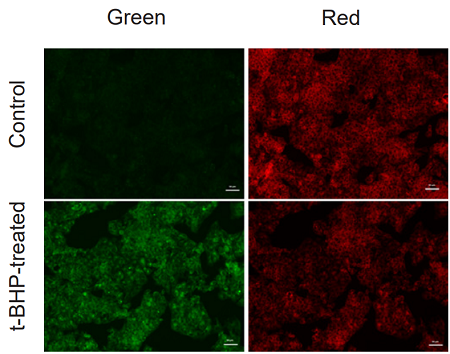
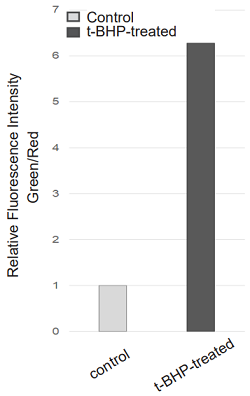
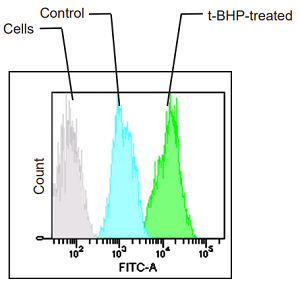
Application Data: Lipid Peroxidation Assay of t-BHP treated HepG2 cells
HepG2 cells stained with this probe were stimulated with HBSS solution containing 200 µmol/l t-BHP for 2 hours, and the fluorescence intensity was compared with control cells. As a result, a decrease in red fluorescence and an increase in green fluorescence were observed with high sensitivity in t-BHP-treated cells compared to untreated cells. The cells were detected using a plate reader, and the values obtained were calculated as the intensity ratio of green/red fluorescence, which allowed quantified lipid peroxidation. Furthermore, an increase in the histogram of green fluorescence was observed when the cells were detected using a flow cytometer. It was found that this dye can be analyzed using three different instruments.
<Experimental Conditions>
Instrument: Fluorescent Microscope
Green: GFP filter (Ex = 450-490 nm, Em = 500-550 nm)
Red: TexasRed filter (Ex = 540-580 nm, Em = 600-660 nm)
Scale bar: 50 µm
<Experimatal Conditions>
Instrument: Fluorescent Plate Reader
Green: Ex = 490 nm, Em = 520-540 nm
Red: Ex = 570 nm, Em = 600-620 nm
<Experimental Conditons>
Instrument: Flow Cytometer
Filter: FITC (Ex = 488 nm, Em = 515-545 nm)
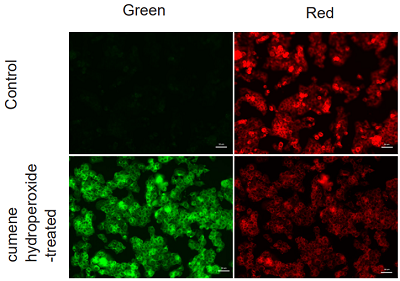
Application Data: Lipid Peroxidation Assay of Cumene hydroperoxide treated HepG2 Cells
HepG2 cells stained with this probe were stimulated with HBSS solution containing 200 µmol/l cumene hydroperoxide for 2 hours, and the fluorescence intensity was compared with control cells. The results showed a decrease in red fluorescence and an increase in green fluorescence in cumene hydroperoxide-treated cells compared to untreated cells, indicating that lipid peroxidation could be detected.
<Experimental Conditions>
Instrument: Fluorescent Microscope
Green: GFP filter (Ex = 450-490 nm, Em = 500-550 nm)
Red: TexasRed filter (Ex = 540-580 nm, Em = 600-660 nm)
Scale bar: 50 µm
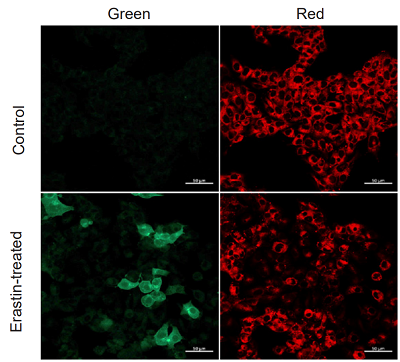
Application Data: Lipid Peroxidation Assay of Erastin treated HepG2 Cells
HepG2 cells were stimulated with MEM medium containing 10 µmol/l Erastin for 2 hours and unstimulated cells were compared using this probe. The results showed a decrease in red fluorescence and an increase in green fluorescence in the stimulated cells compared to the untreated cells, indicating that lipid peroxidation could be detected.
<Experimental Conditions>
Instrument: Confocal Microscope
Green: Ex = 488 nm, Em = 510-550 nm
Red: Ex = 561 nm, Em = 600-630 nm)
Scale bar: 50 µm
References
| No. | Sample Type | Instrument | Reference (Link) |
|---|---|---|---|
| 1) | Cell (HTR-8/Svneo) |
Microscope | H. Yang, X. Zhang, Y. Ding, H. Xiong, S. Xiang, Y. Wang, H. Li, Z. Liu, J. He, Y. Tao, H. Yang, H. Qi, "Elabela: Negative Regulation of Ferroptosis in Trophoblasts via the Ferritinophagy Pathway Implicated in the Pathogenesis of Preeclampsia", cells, 2023, doi:10.3390/cells12010099. |
| 2) | Cell (HLE-B3) |
Microscope | D. Ma, J. Liu, L. Wang, Z. Zhi, L. Luo, J. Zhao, Y. Qin, "GSK-3β-dependent Nrf2 antioxidant response modulates ferroptosis of lens epithelial cells in age-related cataract", 2023, doi:10.1016/j.freeradbiomed.2023.04.022. |
Q & A
-
Q
How may samples can be tested by this kit?
-
A
Please refer to the followings:
・96-well plate: 2 plates
・ibidi 8-well plate: 12 plates
・35 mm dish: 10 dishes
・6-well plate: 10 well
-
Q
Is there a positive control experiment for lipid peroxidation assay?
-
A
The manual includes examples of detection using tert-butyl hydroperoxide (t-BHP) or cumene hydroperoxide-treated HepG2 cells. (Please refer to steps 1-5 in Application Data 1 and Application Data 2).
-
Q
When using a flow cytometer in which step should I detach the cells from the plate?
-
A
Please follow step 6 of the manual, after the treatment and washing with HBSS, detach the cells with trypsin.
-
Q
Can I use other buffers in stead of HBSS to wash the cells after the staining?
-
A
Yes, you may use PBS, Hanks’ HEPES buffer, and a medium to wash the cells.
-
Q
What medium should I use to dilute the working solution?
-
A
The serum may affect results.
Therefore, it is recommended to use the serum-free medium first.
<Experimental example>
〇 The effect of serum in Erastin+RSL3 treated cells1. HepG2 cells were seeded and cultured overnight for 24 hours at 37 ℃, 5% CO2.
2. The culture medium was removed and the cells were washed twice with MEM (FBS+) medium.
3. The supernatant was removed and 25 µM Erastin+25 µM RSL3/MEM (FBS+) solution was added and incubated for 24 hours at 37 ℃, 5% CO2.
4. The supernatant was removed and the cells were washed twice with MEM(FBS+) or MEM(FBS-) medium. BDP 581/591 C11 working solution (1000x) prepared in MEM (FBS+) or MEM (FBS-) medium was added and incubated for 30 min at 37 ℃, 5% CO2.
5. The supernatant was removed and the cells were washed twice with HBSS.
6. The cells were observed under a fluorescence microscope.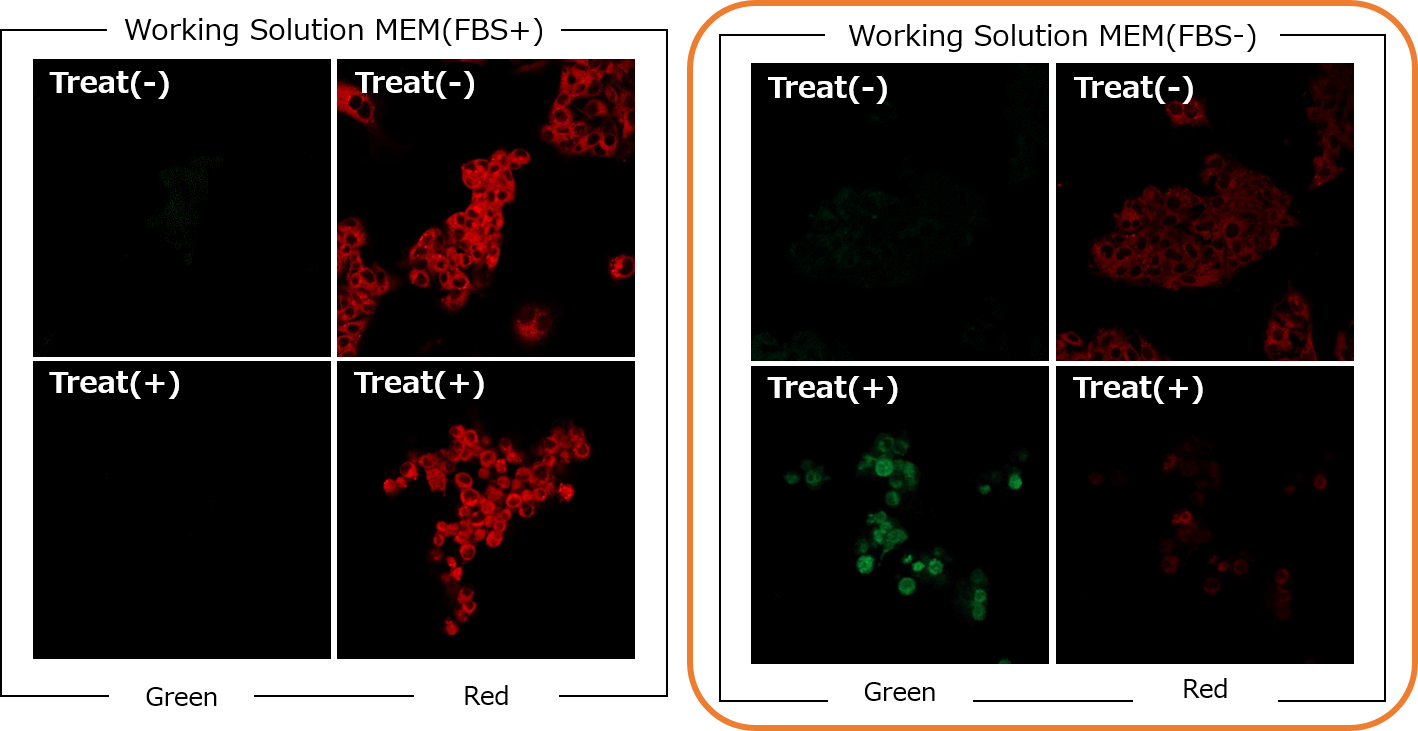
[Detection Conditions]
Green: Ex/Em 488/500–550 nm (2.0 %, 600 V)
Red: Ex/Em 561/564–620 nm (0.2 %, 500 V)
Lens: ×20〇 Cases where the use of serum media may be an option. (t-BHP)
1. HepG2 cells were seeded and cultured overnight for 24 hours at 37 ℃, 5% CO2.
2. The culture medium was removed and the cells were washed twice with MEM (FBS+) medium.
3. BDP 581/591 C11 working solution (1000x) prepared in MEM (FBS+) medium was added and incubated for 30 min at 37 ℃, 5% CO2.
4. The supernatant was removed and the cells were washed twice with HBSS, and 200 µM t-BHP/HBSS solution was added and incubated for 2 hours at 37 ℃, 5% CO2.
5. The supernatant was removed and the cells were washed twice with HBSS.
6. The cells were observed under a fluorescence microscope.
[Detection Conditions]
Green: GFP filter (Ex: 470/40 nm, Em: 525/50 nm)
Red: TexasRed filter (Ex: 560/40 nm, Em: 630/75 nm)
-
Q
How to optimize the concentration of working solution?
-
A
The optimal concentration depends on cell types.
Please refer to the following steps.・Prepare working solutions with multiple concentrations for detection.
・Decide on the optimal concentration that meets the following two conditions.
➀ Better clarity of S/N.
➁ Less dye aggregation.*When diluting the working solution in serum-free medium, dyes aggregate depending on the concentration.
If there is any possibility of affecting the cells, check with bright field.*Less dye aggregation is observed by using serum-containing medium than serum-free medium.
<Experimental example: Evaluation of optimal concentration in HepG2 cells>
The optimal concentration of BDP 581/591 C11 working solution was examined in HepG2 cells treated with 25 µM Erastin+25 µM RSL3 for 24 hours.
Serum-free MEM medium was used to dilute the working solution.
➀Better clarity of S/N.
2000x or 1000x dilution is suitable in this conditions.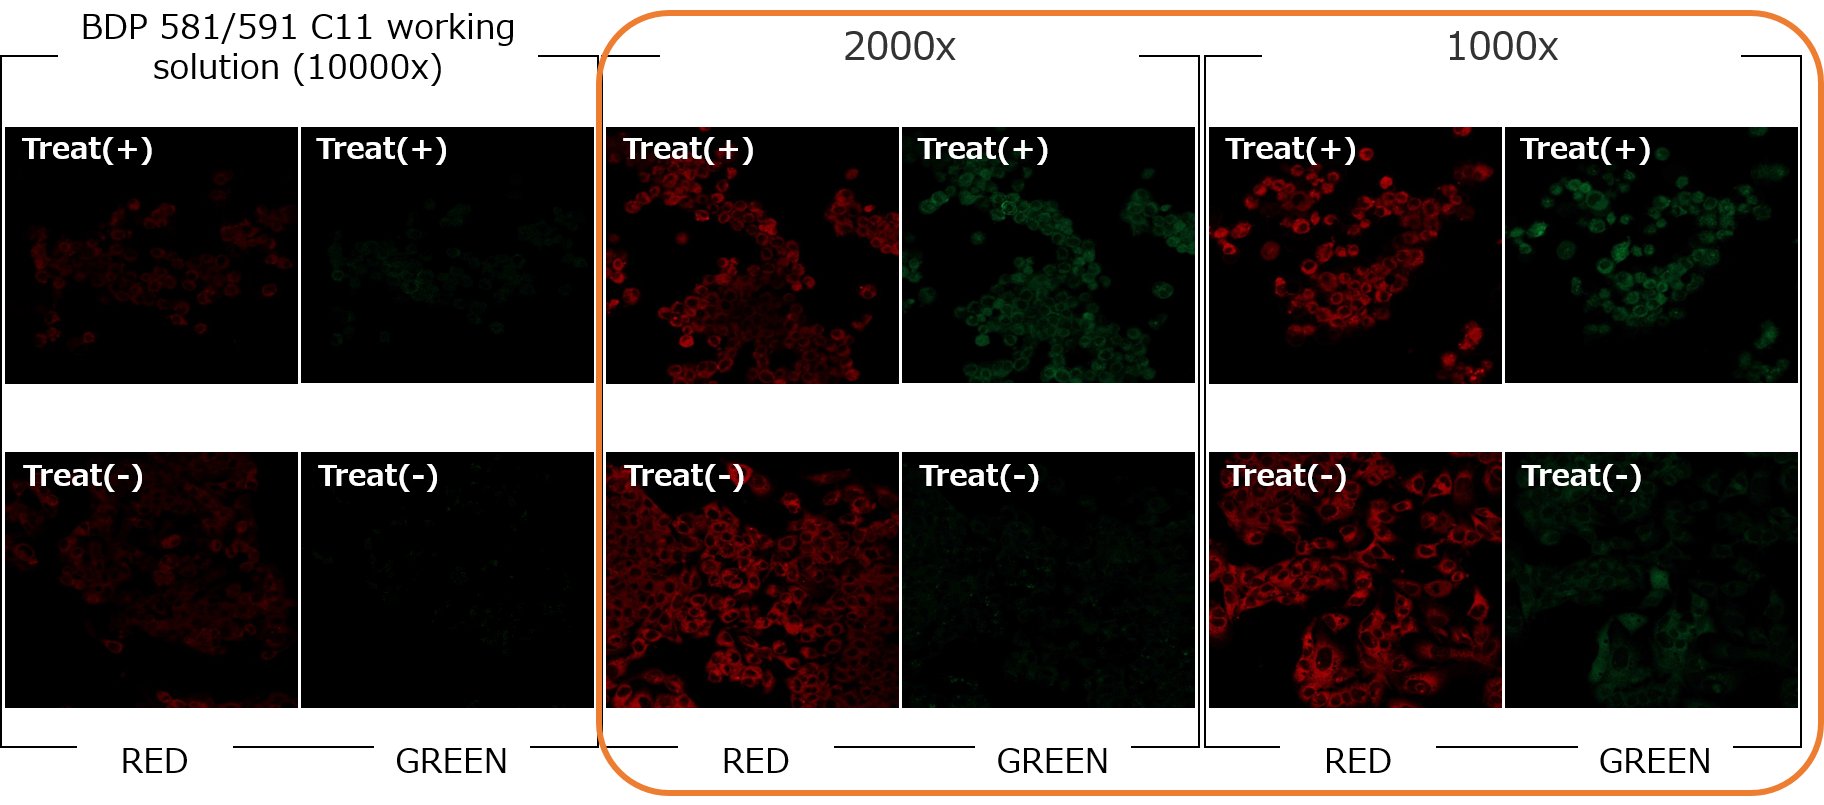
[Detection Conditions]
Green: Ex/Em 488/500–550 nm (2.0 %, 600 V)
Red: Ex/Em 561/564–620 nm (0.2 %, 500 V)
Lens: ×20➁Less dye aggregation
In the 1000x dilution, dye aggregation was observed in some places.
The optimum concentration was determined to be a 2000x dilution, which has a clear S/N and less dye aggregation.
*In serum-containing medium, no dye aggregation was observed even at a 1000x dilution.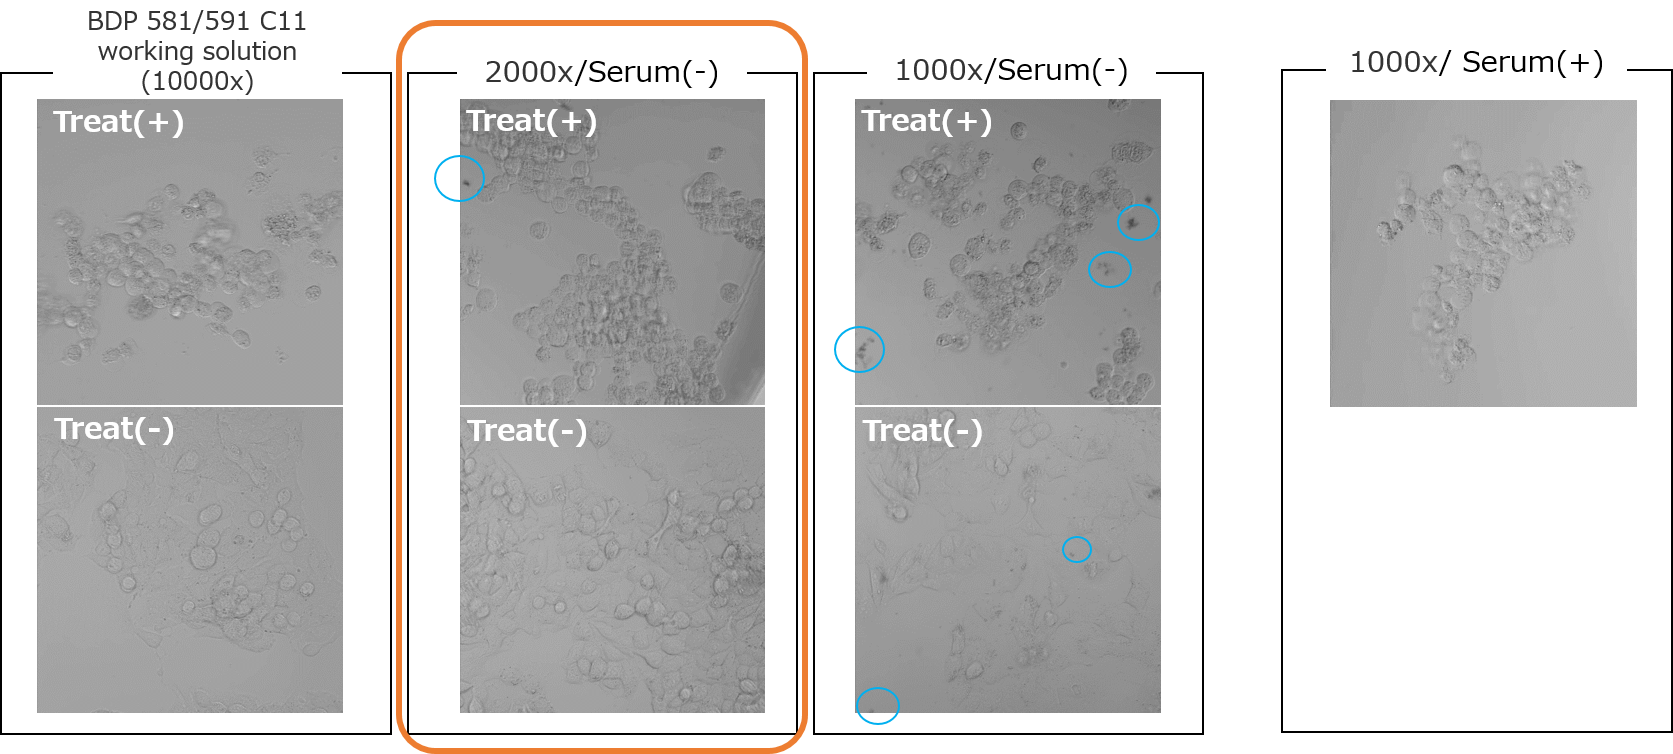
Handling and storage condition
| Appearance: | Purple Solid |
|---|---|
| Purity (HPLC): | 90.0% |
| Store in a cool, dark place. |
Related products
The following related products are also used in research related to this product.


