Cellular Senescence: Review and Reagent Selection Guide
Science Note
p53-Induced Senescence Links Lysosomal and Autophagy Activation [Feb. 24, 2026]
| p53 activation contributes to tumor suppression in cancer and can induce cellular senescence depending on context. This article highlights recent findings on p53-driven senescence and its relationship to lysosome and autophagy pathways. Recent studies showed that, in senescent cells, p53 promotes autophagy- and lysosome-dependent lipid recycling, increasing phosphoethanolamine supply to meet phospholipid demand from cellular hypertrophy and organelle remodeling. In a lung cancer model, p53 reactivation induced a TSC2-mTORC1-TFEB cascade that upregulated lysosome and autophagy programs, leading to autophagy-dependent senescence and tumor regression through macrophage-mediated clearance of senescent cells. Together, these findings advance our understanding of p53-driven senescence and indicate that lysosome and autophagy pathways contribute to this process. | ||||||||||||||||||
|
p53 increases phospholipid headgroup scavenging in senescence (Nature Cell Biology, 2026) Highlighted technique: SA-βGal , a senescence marker based on lysosome-derived β-galactosidase activity, was used to confirm and quantify senescence under p53 ON/OFF and PE synthesis–inhibiting conditions. p53 was controlled by Nutlin-3a–mediated activation or dox-based p53 ON/OFF regulation, and the senescent fraction was quantified by counting the percentage of SA-βGal–positive cells. |
||||||||||||||||||
|
p53 Drives Lung Cancer Regression through a TSC2/TFEB-dependent Senescence Program (Cancer Discovery, 2026) Highlighted technique: The authors tested whether p53 reactivation truly increases autophagy activity in lung cancer cells by monitoring LC3-II, an autophagosome-associated marker, and the lysosomal marker LAMP1. After confirming that p53 elevated LC3-II and LAMP1, they added bafilomycin and observed further LC3-II accumulation, supporting active autophagic flux rather than impaired degradation under p53 reactivation. |
||||||||||||||||||
Senescence, Autophagy and Lysosome Indicators (click to open/close)
|
||||||||||||||||||
Application Note (click to open/close)
|
||||||||||||||||||
|
|
NAD(+) levels decline during the aging process, causing defects in nuclear and mitochondrial functions and resulting in many age-associated pathologies*. Here, we try to redemonstrate this phenomenon in the doxorubicin (DOX)-induced cellular senescence model with a comprehensive analysis of our products. *S. Imai, et al., Trends Cell Biol, 2014, 24, 464-471
|
 |
|
Topics
What is Senescence?
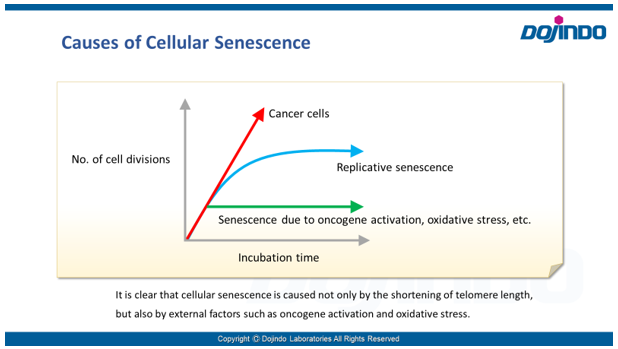 Senescence in cell biology refers to a state of permanent cell cycle arrest in response to stresses such as DNA damage or oncogene activation. Senescent cells can be identified by several molecular markers. Representative examples include p53, a transcription factor involved in the DNA damage response; p16, a cyclin-dependent kinase inhibitor that enforces cell cycle arrest; and senescence-associated β-galactosidase (SA-βgal). These cells resist apoptosis and ferroptosis and secrete inflammatory factors, collectively known as the senescence-associated secretory phenotype (SASP). Although senescence plays protective roles such as tumor suppression in early stages, the accumulation of these cells over time promotes chronic inflammation and contributes to several age-related diseases. As immune-mediated clearance of senescent cells declines with age, understanding their biology is crucial for the development of therapies targeting ageing and its associated diseases.
Assessing Cellular Senescence
- Cellular senescence is controlled by various factors such as cell type and physiological conditions, such as oxidative stress. None of the individual biomarkers that have been identified so far have been deemed to be specific to senescent cells. Therefore, it is desirable to determine and confirm cellular senescence using multiple indicators.
Common detection indicators for assessing cellular senescence include features related to cell cycle progression (DNA synthesis, p16/p21 expression, etc.), features related to morphology (of the cell, nucleus, nucleolus, etc.), SA-ß-Gal activity, DNA damage, oxidative stress (ROS), telomere length, inflammatory cytokines (senescence-associated secretory phenotype (SASP)), and more.
< Video Seminar >
“Recent Findings of Cellular Senescence Studies and Analysis Method”
Reagent Selection Guide
Dojindo offers four types of kits and reagents that can be selected according to the evaluation method and purpose of cell senescence.
| Product | Cellular Senescence Detection Kit – SPiDER-ßGal, SPiDER Blue | Cellular Senescence Plate Assay Kit – SPiDER-ßGal | Cell Cycle Assay Solution Deep Red / Blue | Nucleolus Bright Green / Red |
|---|---|---|---|---|
| Detection | Fluorescence | Fluorescence | Fluorescence | Fluorescence |
| Wavelength (Ex/Em) |
[SPiDER-ßGal] Ex. 500–540 nm/Em. 530–570 nm [SPiDER Blue] Ex. 350-450 nm/Em. 400-500 nm |
Ex. 535 nm / Em. 580 nm | Deep Red: Ex. 633-647 nm / Em. 780/60 nm Blue: Ex. 405-407 nm / Em. 450/50 nm |
Green: Ex. 513 nm / Em. 538 nm Red: Ex. 537 nm / Em. 605 nm |
| Target | SA-ß-gal activity | SA-ß-gal activity | Nucleus | Changes in the nucleolus |
| Detection Method |
Imaging, Flow cytometry Substrate: SPiDER-ßGal, SPiDER Blue |
Plate assay Substrate: SPiDER-ßGal |
Flow cytometry | Imaging Detection of the nucleolus by RNA-staining reagent |
| Instrument | Fluorescence microscope, FCM | Fluorescence microplate reader | FCM | Fluorescence microscope |
| Sample | SPiDER-ßGal: Live or fixed cells SPiDER Blue: Fixed cells (Tissue: some examples from published articles using SG02) |
Live cells (lysis of live cells) |
Live cells, fixed cells | Fixed cells |
| Best for | Those who have difficulty quantifying data or performing multiple staining with X-gal | Those who process multiple samples Those who are evaluating senescent cells for the first time Small size package (20 tests) is available |
Those who wish to evaluate using indicators other than SA-ß-Gal | Those who wish to evaluate using indicators other than SA-ß-Gal Examples of reports using nucleolus as an indicator are available on the product page |
| data | 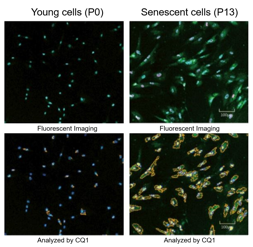 |
 |
 |
 |
| Item# | SPiDER-ßGal: SG03(SG04) SPiDER Blue: SG07 |
SG05 | Deep Red: C548 Blue: C549 |
Green: N511 Red: N512 |
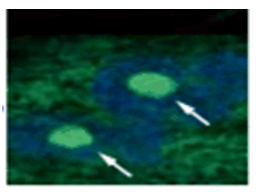
Indicators Related to Cellular Senescence
This correlation map shows the relationship between various intracellular indicators, resulting from cellular senescence. This information is based on currently available information. Please refer to the table with cited references below as reference for your experiments. The table lists the cell type, the method of senescence induction used, the senescence markers measured, and the variables affected by senescence in each reference for the map.
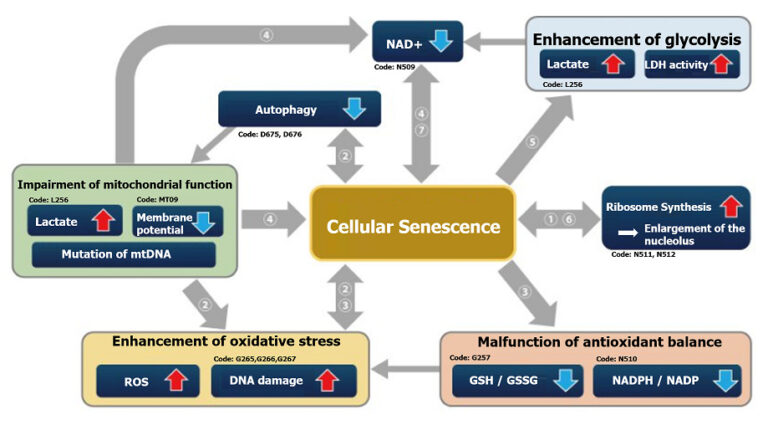
| Cell | Senescence induction | Senescence marker (s) | Responding variable (s) | Reference | |
|---|---|---|---|---|---|
| ① | IMR90 (Human pulmonary fibroblasts) |
Several passages in culture | SA-ß-Gal, p16, p21, Nucleosome hypertrophy | Expression of SETD8↓, H4K20me1↓, oxidative phosphorylation↑, ribosome synthesis↑ | H. Tanaka, S. Takebayashi, A. Sakamoto, N. Saitoh, S. Hino and M. Nakao, “The SETD8/PR-Set7 Methyltransferase Functions as a Barrier to Prevent Senescence-Associated Metabolic Remodeling.”, Cell Reports, 2017, 18(9), 2148. |
| Inhibition of SETD8 (Methyltransferase) |
Oxidative phosphorylation↑, ribosome synthesis↑ | ||||
| ② | Senescent mouse satellite cell eletal muscle progenitor cells) |
– | SA-ß-Gal, p16 | Autophagy activity↓, ROS↑, mitochondrial membrane potential↓ | L. Garcia-Prat, M. Martinez-Vicente and P. Munoz-Canoves, “Autophagy: a decisive process for stemness”, Oncotarget, 2016, 7(11), 12286. |
| Atg7 knockout mouse (Satellite cells) |
Autophagy inhibition | SA-ß-Gal, P15, p16, p21, γ-H2AX | ROS↑, mitochondrial membrane potential↓ | ||
| ③ | Rat fibroblast model of type 2 diabetes | – | SA-ß-Gal, p21, p53, γ-H2AX | NADP+/ NADPH↓(resistance to oxidative stress↓), NADPH oxidase↑(ROS↑) | M. Bitar, S. Abdel-Halim and F. Al-Mulla, “Caveolin-1/PTRF upregulation constitutes a mechanism for mediating p53-induced cellular senescence: implications for evidence-based therapy of delayed wound healing in diabetes”, Am J Physiol Endocrinol Metab., 2013, 305(8), E951. |
| ④ | IMR90 (Human pulmonary fibroblasts) |
Ethidium bromide (inhibition of mtDNA) + pyruvate deficiency | SA-ß-Gal | NAD+/NADH | C. Wiley, M. Velarde, P. Lecot, A. Gerencser, E. Verdin, J. Campisi, et. al., “Mitochondrial Dysfunction Induces Senescence with a Distinct Secretory Phenotype”, Cell Metab., 2016, 23(2), 303. |
| ⑤ | MDA-MB-231 (Human breast cancer cells) |
X-ray irradiation + inhibition of cell cycle-related factor (securin) expression | SA-ß-Gal | Lactate↑, LDH activity↑, (glycolysis↑) | E. Liao, Y. Hsu, Q. Chuah, Y. Lee, J. Hu, T. Huang, P-M Yang & S-J Chiu, “Radiation induces senescence and a bystander effect through metabolic alterations.”, Cell Death Dis., 2014, 5, e1255. |
| ⑥ | MEF (Mouse Embryonic Fibroblast) |
Overexpression of oncogenes,several passages in culture, transcription factor overexpression(E2F1) | SA-ß-Gal, p16, p21, Nucleosome hypertrophy | Ribosome RNA↑, p53↑ | K. Nishimura, T. Kumazawa, T. Kuroda, A. Murayama, J. Yanagisawa and K. Kimura, “Perturbation of Ribosome Biogenesis Drives Cells into Senescence through 5S RNP-Mediated p53 Activation”, Cell Rep. 2015, 10(8), 1310. |
| ⑦ | Mouse tail fibroblast | 2 months old, 22 months old, p16 knockout (22 months old) | SA-ß-Gal, p14, p16 | NAD+↓, SIRT3↓ | M. J. Son, Y. Kwon, T. Son and Y. S. Cho, “Restoration of Mitochondrial NAD+ Levels Delays Stem Cell Senescence and Facilitates Reprogramming of Aged Somatic Cells”, Stem Cells. 2016, 34(12), 2840. |
Accumulation of Lipid Peroxides and Their Connection to Cellular Senescence and Mitochondria
Lipotoxicity is caused by intracellular lipid accumulation and is indicative of mitochondrial disfunction. Lipotoxicity accelerates the degenerative process of cellular senescence, influencing cancer development.

References
1. Clara, C. al., “Mitochondria: Are they causal players in cellular senescence?”, Biochimica et Biophysica Acta – Bioenergetics, 2015, 1847(11), 1373-1379.
2. Huizhen, Z. et al., “Lipidomics reveals carnitine palmitoyltransferase 1C protects cancer cells from lipotoxicity and senescence”, Journal of Pharmaceutical Analysis, 2020.
3. Xiaojuan, H. et al., “Astrocyte Senescence and Alzheimer’s Disease: A Review”, Front. Aging Neurosci., 2020.
4. Borén, J. et al., “Apoptosis-induced mitochondrial dysfunction causes cytoplasmic lipid droplet formation”, Cell Death Differ, 2012, 19(9), 1561-1570.
5. Na, L. et al., “Aging and stress induced β cell senescence and its implication in diabetes development”, Aging (Albany NY), 2019, 11(21), 9947–9959.
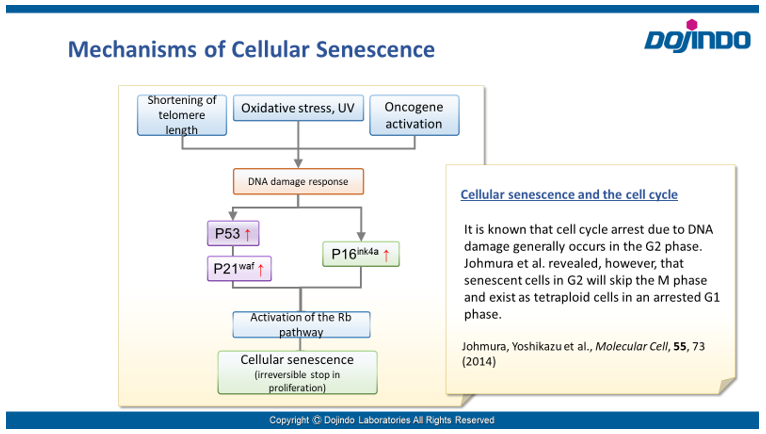
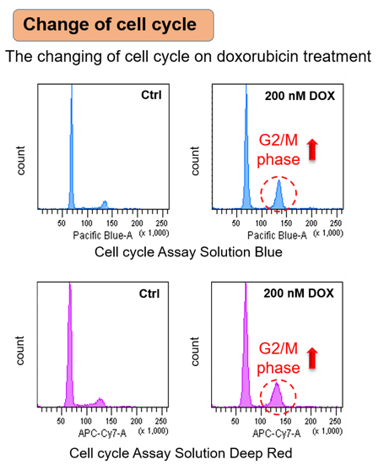
Cell Cycle Arrest
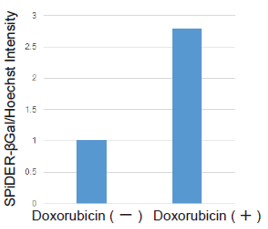
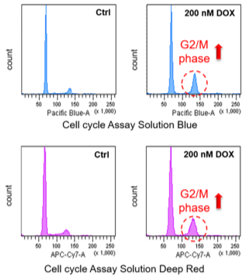
Irreversible cell cycle arrest is one of the phenomena that characterize cellular senescence. p16, p21, p53, and pRB (phosphorylated retinoblastoma protein) are known as representative protein markers. The activation/upregulation of these proteins are used as indicators of cellular senescence. These marker proteins are known to be tumor suppressors and regulate the cell cycle mainly through two pathways (p16Ink4a-RB and p53-p21CIP1).
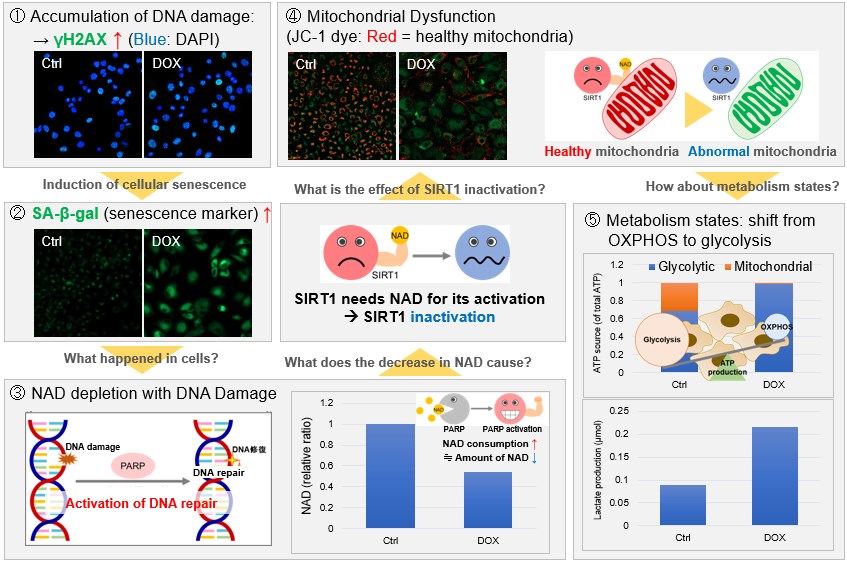
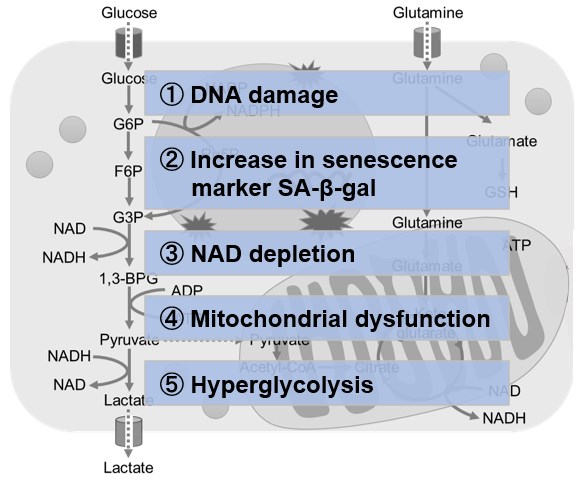
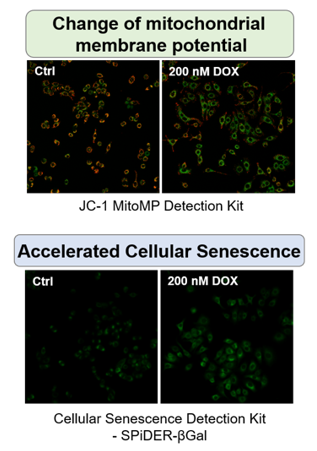
Doxorubicin (DOX) is known as an anticancer drug that acts in the G2/M phase of the cell cycle to arrest cell proliferation and induce cellular senescence (see the figure below in center). Below are the results of an experiment in which DOX was added to A549 cells. As a result, changes in SA-ß-Gal expression, cell cycle progression, and mitochondrial membrane potential were observed.
 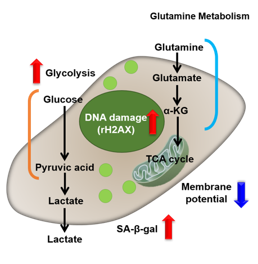  |
Changes in Intracellular Metabolism
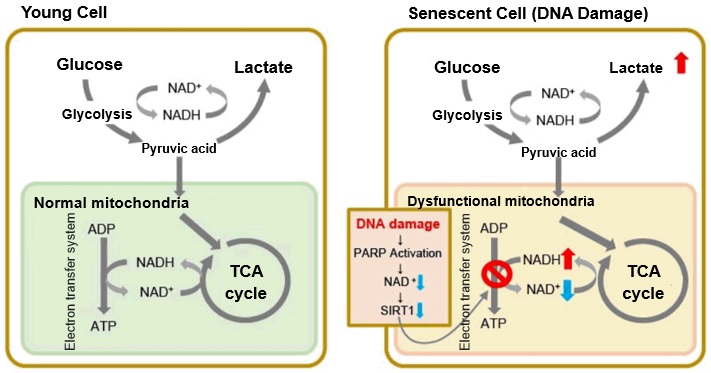
-
In aged cells, due to mitochondrial dysfunction, ATP is primarily generated through the anaerobic glycolysis pathway, leading to an increase in lactate production2). DNA damage is one of the causes of mitochondrial dysfunction in cellular aging. The accumulation of DNA damage activates DNA repair mechanisms and increases NAD+ consumption. The decrease in NAD+ levels reduces SIRT1 activity, an important factor in maintaining mitochondrial function, leading to impaired mitochondrial function (inhibition of electron transfer → ATP production / reduction of NAD+ levels)1),3).
Reference:
1. J. Wu, Z. Jin, H. Zheng and L. Yan, “Sources and implications of NADH/NAD+redox imbalance in diabetes and its complications”, Diabetes Metab. Syndr. Obes., 2016, 9, 145
2. Z. Feng, R. W. Hanson, N. A. Berger and A. Trubitsyn, “Reprogramming of energy metabolism as a driver of aging”, Oncotarget., 2016, 7(13), 15410.
3. S. Imai and L. Guarente, “NAD+ and sirtuins in aging and disease”, Trends in Cell Biology, 2014, 24(8), 464.
-
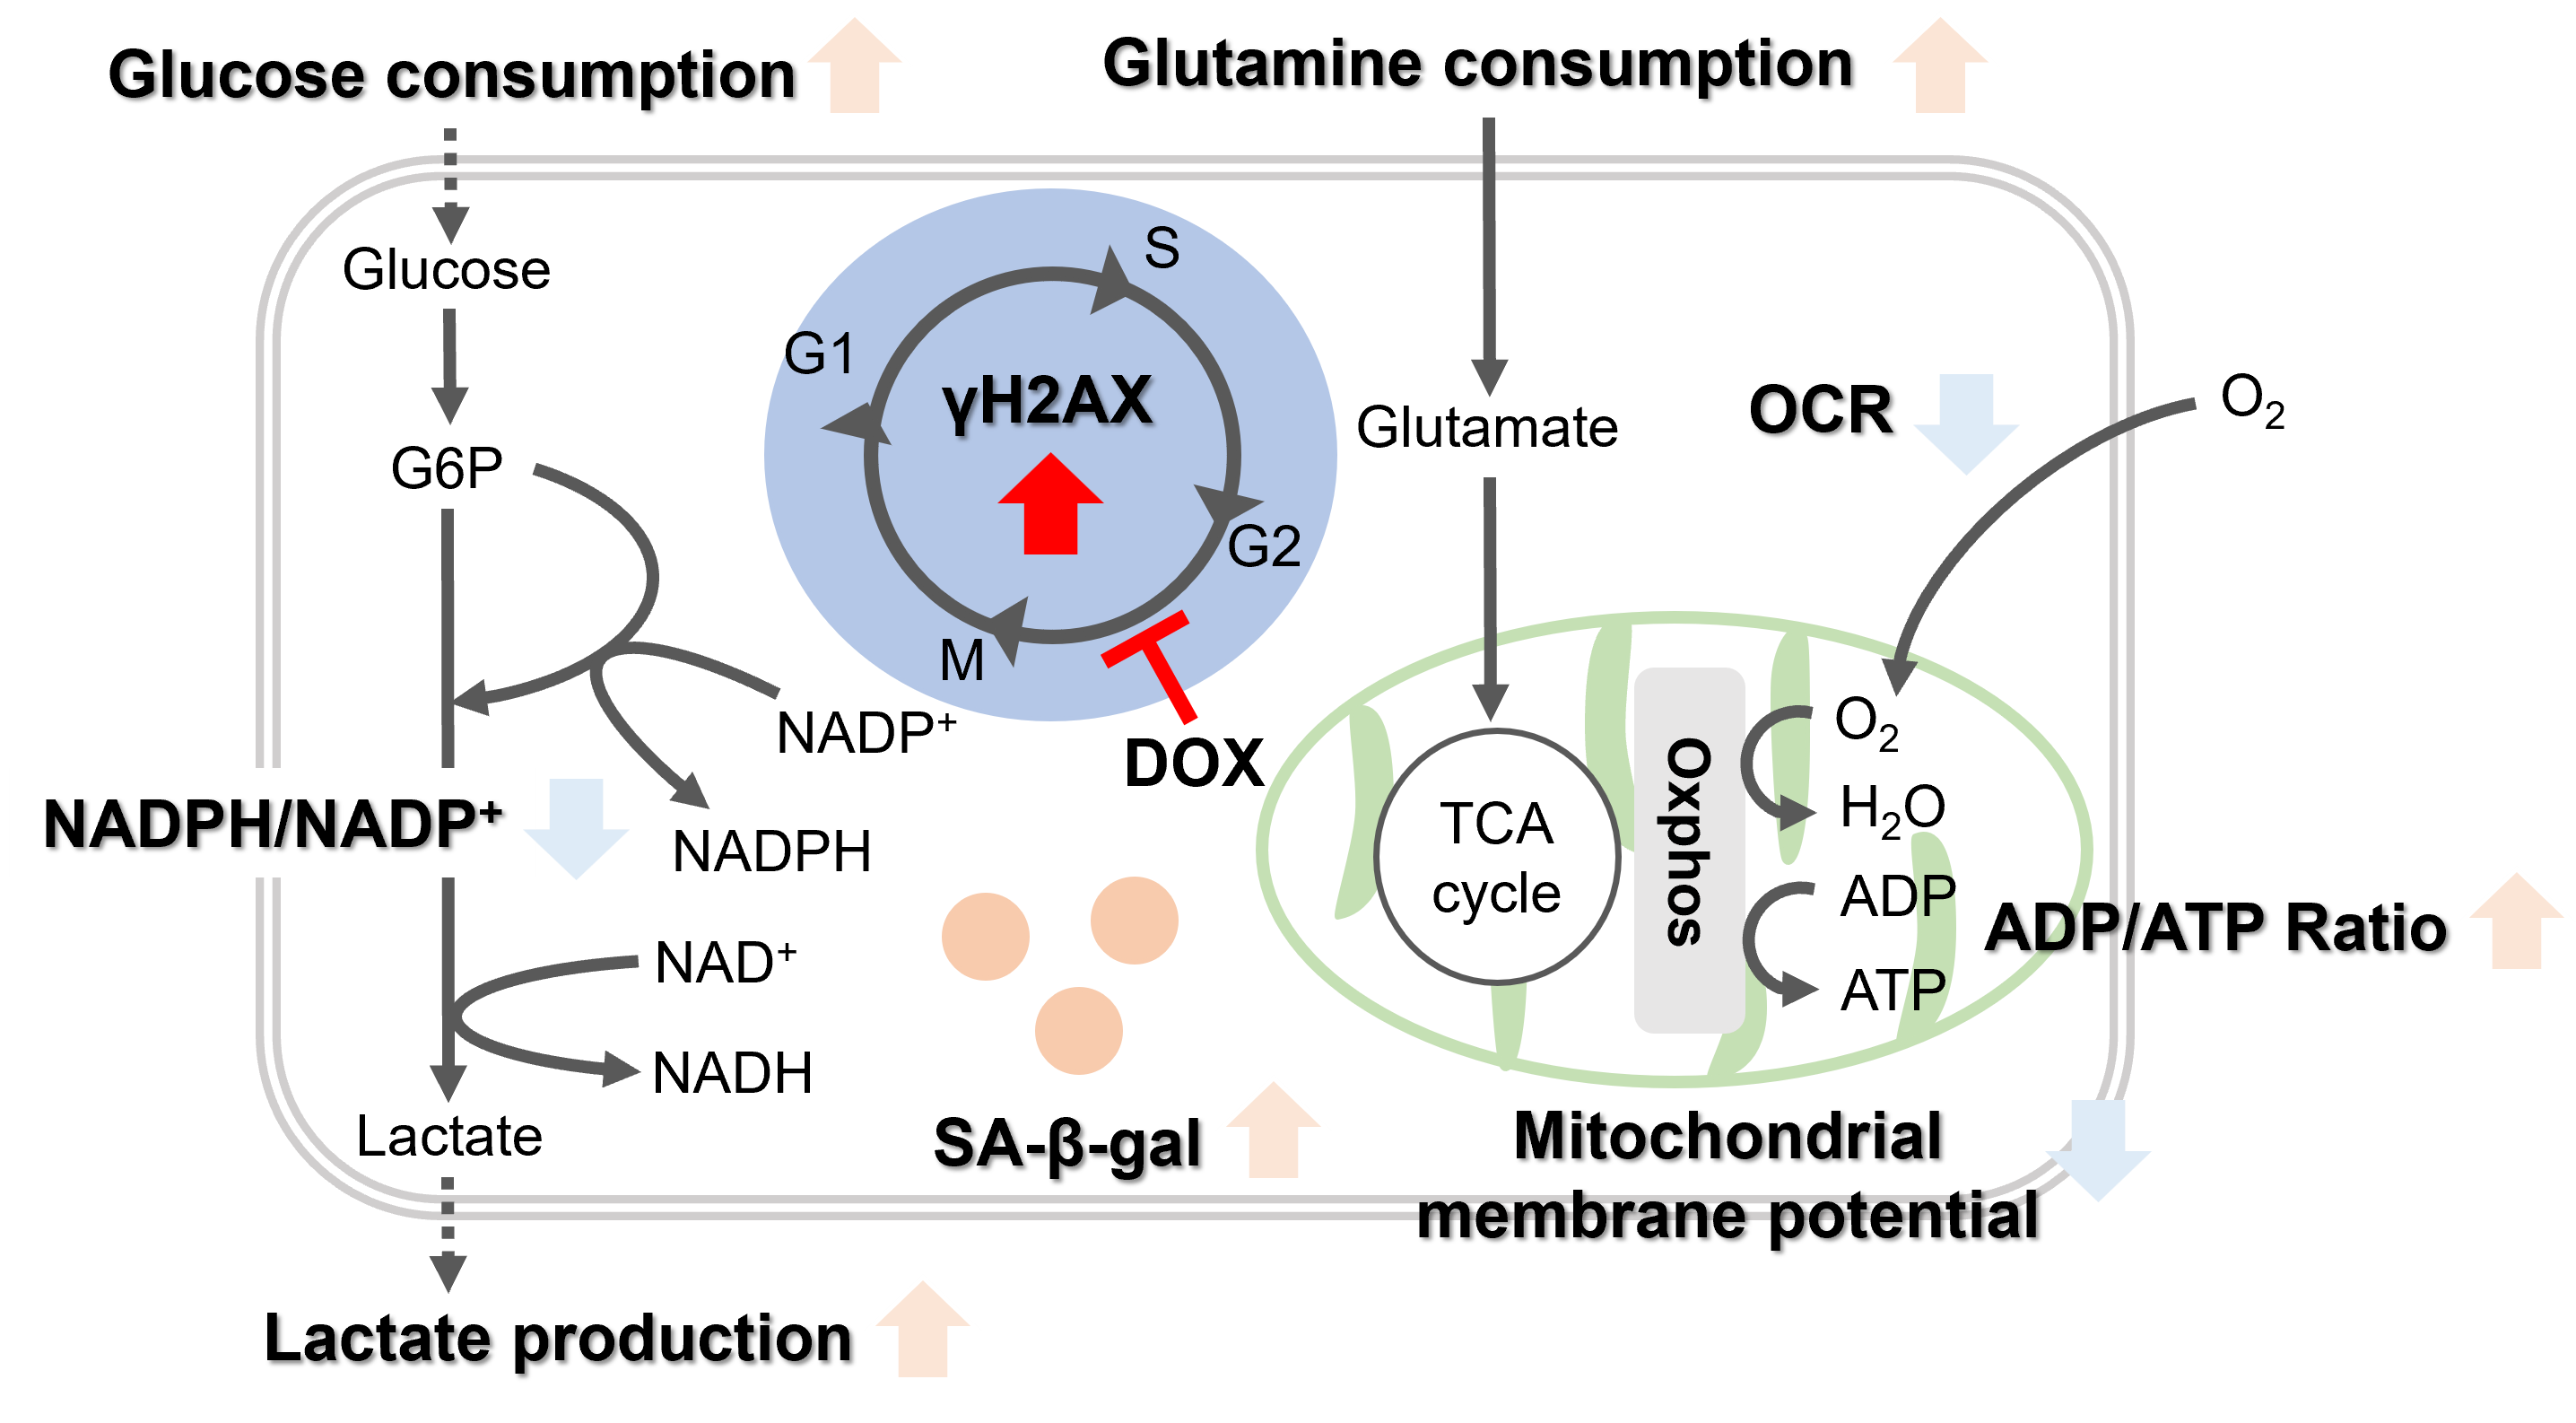
Oxidative stress & accelerated aging: ①SA-β-gal Impairment of mitochondrial function: ③ Mitochondrial membrane potential ④ Oxygen consumption rate (OCR)
-
Upregulation of glycolysis pathway and glutamine metabolism ⑥ Glucose consumption ⑦ Lactate production ⑧ Glutamine consumption
-
Reduction in antioxidant capacity: ⑨ NADPH/NADP+ ratio
-
DNA repair mechanisms: