Review: Cellular Metabolism in Disease (Cancer, Diabetes, Senescence, and NASH)
Science Note
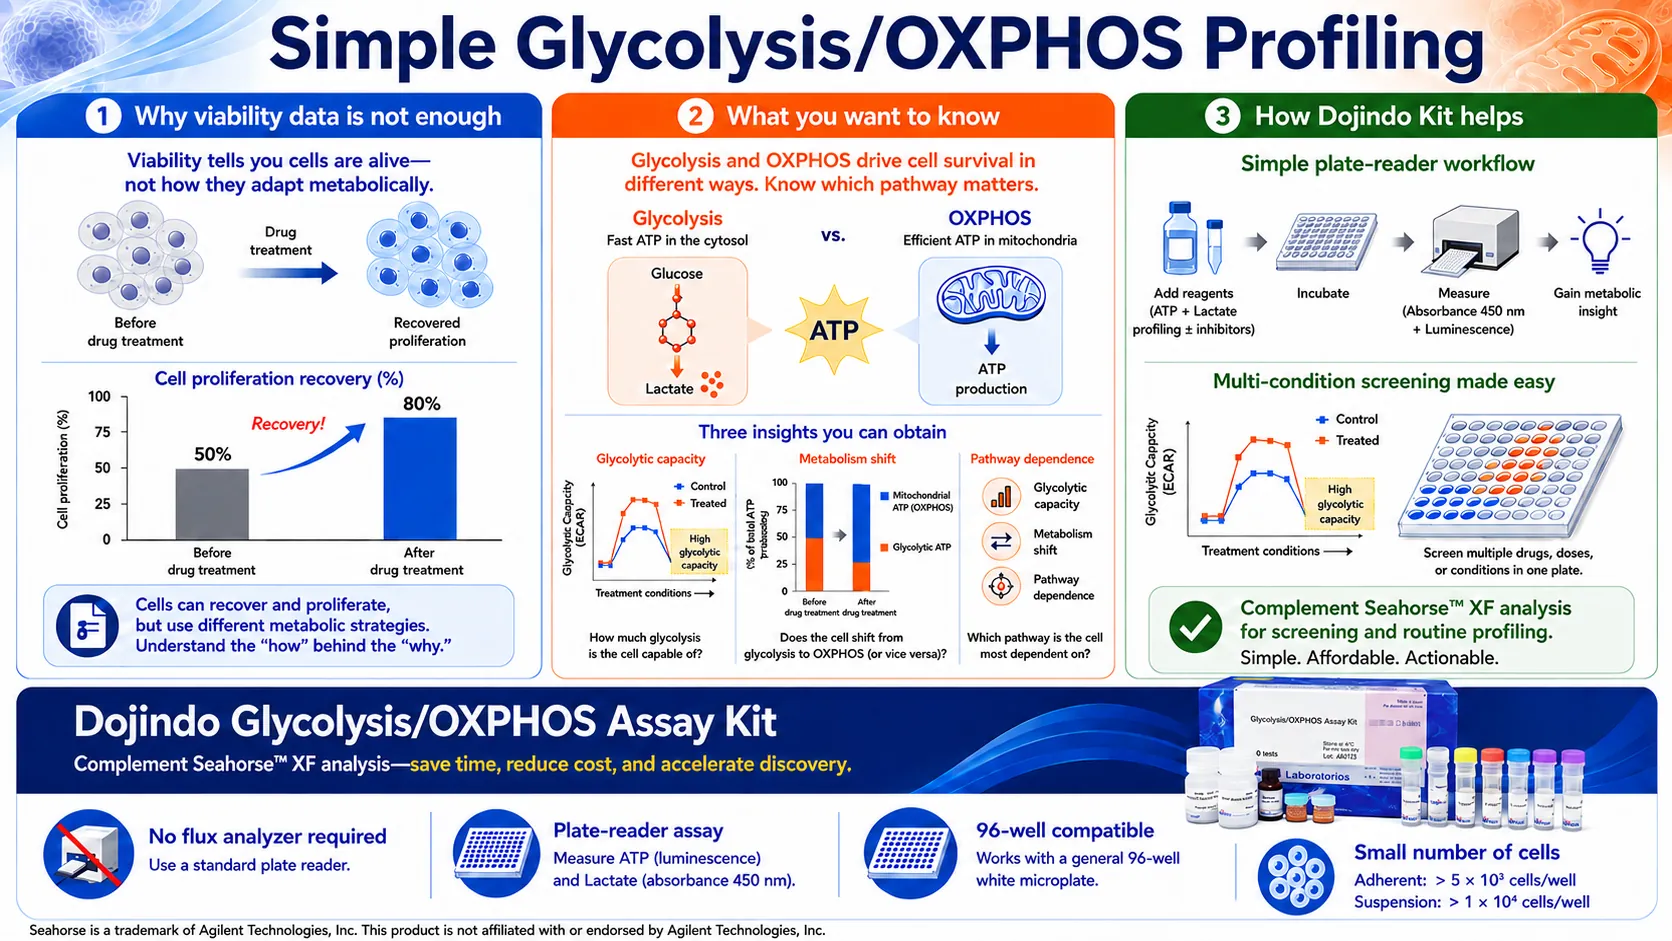
Rethinking Glycolysis/OXPHOS in Cancer [June. 4, 2026]
|
Cancer cell metabolic states have recently been suggested to require multiparametric assessment, including glycolysis/OXPHOS dependence, mitochondrial abundance and membrane potential, and the utilization of metabolic substrates such as lactate. One study revealed that mitochondrial abundance does not necessarily correlate with OXPHOS dependence in CRC cells. Another showed that lactate is not merely a glycolytic waste product but a reusable mitochondrial fuel that can support OXPHOS and stemness in metastatic breast cancer cells. |
||||||||||||||||||||||||||||||||||||||||||||
|
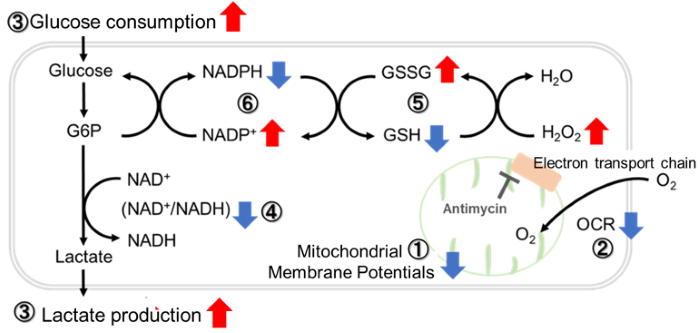
Mitochondrial, metabolic and bioenergetic adaptations drive plasticity of colorectal cancer cells and shape their chemosensitivity (Markov, et al., Cell Death & Disease, 2025) Highlighted technique: A Glycolysis/OXPHOS assay kit and OCR plate-assay kit provides a low-cost, low-cell-number approach screening for samples before committing to full Seahorse analysis. |
||||||||||||||||||||||||||||||||||||||||||||
|
Lactate mitochondrial oxidation drives stemness potential in metastatic breast cancer (Zhang, et al., Nature communications, 2025) Highlighted technique: A mitochondrial fractionation kit enables the collection of intact mitochondria from tissue samples, allowing direct assessment of mitochondrial function, including OCR and Complex I activity. Additionally, intracellular ATP and α-KG can serve as readouts of mitochondrial metabolic changes. |
||||||||||||||||||||||||||||||||||||||||||||
|
|
||||||||||||||||||||||||||||||||||||||||||||
Metabolic and Mitochondrial Activity Indicators (click to open/close)
|
Application Note II (click to open/close)
|
|||||||||||||||||||||||||||||||||||||||||||
|
|
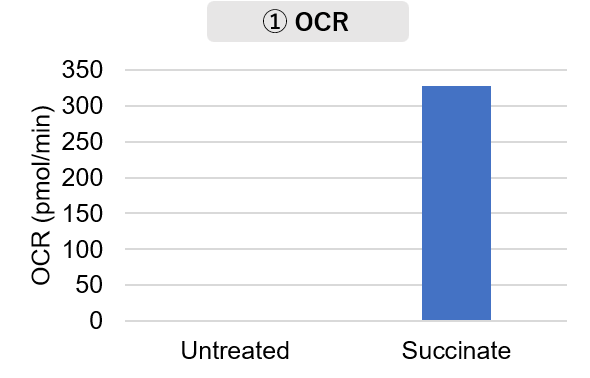
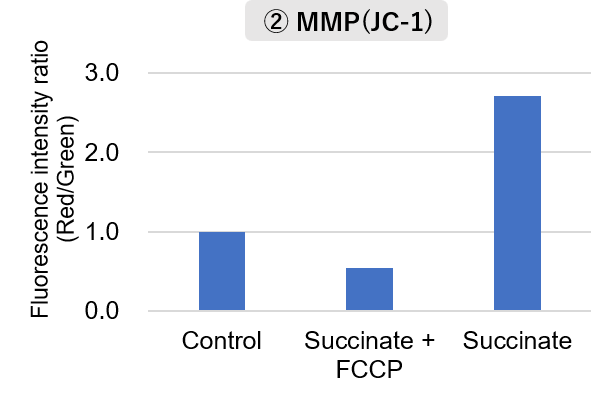
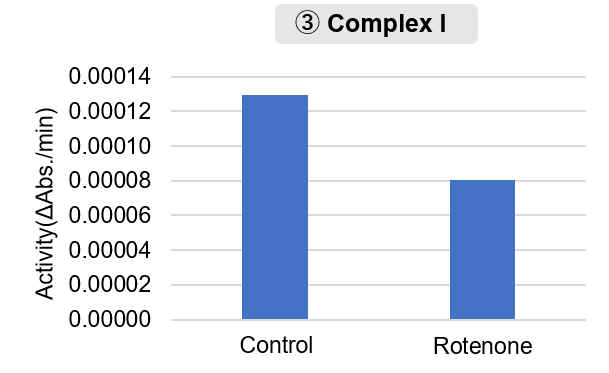
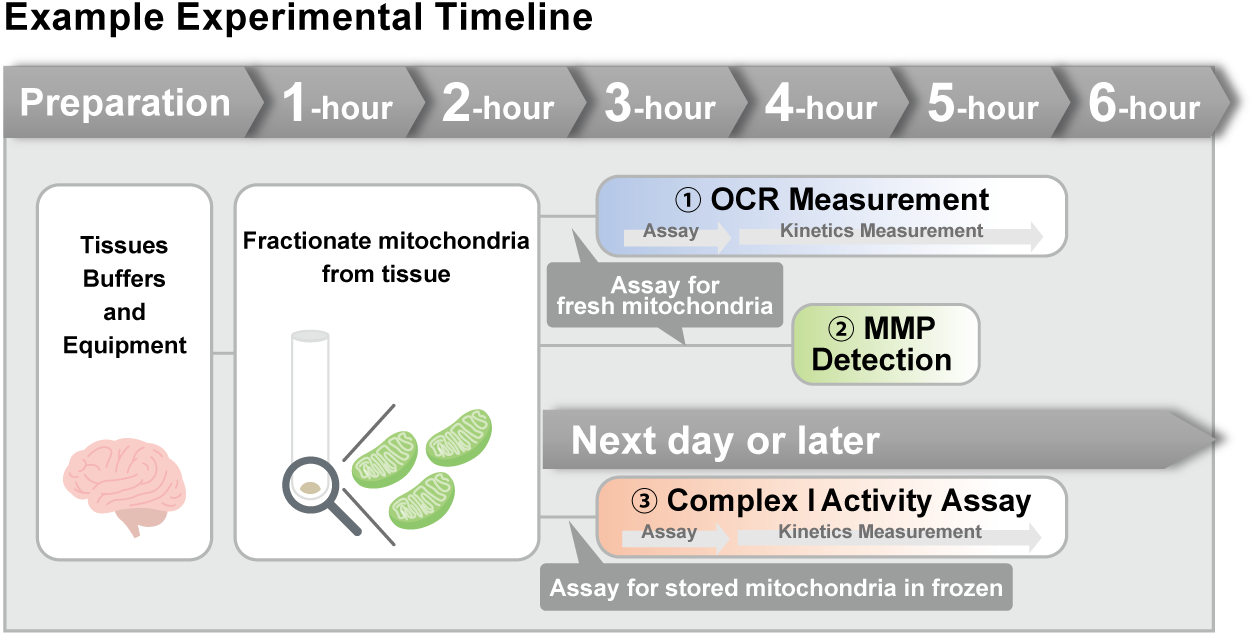
Mitochondria were isolated from mouse brain tissue, and oxygen consumption rate (OCR), mitochondrial membrane potential (MMP), and Complex I activity were measured. The results showed that the addition of succinate, a substrate that activates Complex II of the electron transport chain, increased both OCR and MMP. In contrast, FCCP treatment reduced MMP, indicating that intact mitochondria were successfully fractionated. |
   |
|
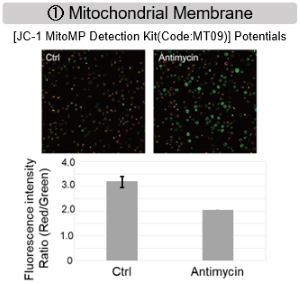
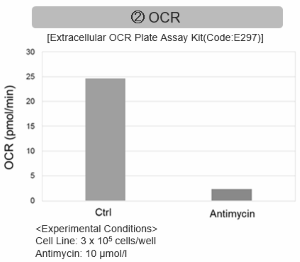
| <Product used> Mitochondrial Fractionation: IntactMito Fractionation Kit for Tissue (Code: MT17) OCR measurement: Extracellular OCR Plate Assay Kit (Code: E297) MMP detection: JC-1 MitoMP Detection Kit (Code: MT09) Complex I activity assay: MitoComplex- I Activity Assay Kit (Code: MT18) |
<Experimental Conditions> |
Why is metabolic analysis important?
Metabolic analysis is essential for understanding cellular energy regulation, as metabolic pathways control ATP production, redox balance, and biosynthesis. Assessing key metabolic processes such as glycolysis, oxidative phosphorylation, and metabolite flux provides insight into cellular function and disease progression. For example, cancer cells exhibit enhanced glycolysis, neurodegenerative diseases involve mitochondrial dysfunction, and senescent cells show reduced mitochondrial efficiency and increased oxidative stress. Understanding these metabolic changes is critical for developing targeted therapies.
Metabolites Detection Kits and Reagents
| Target object | Indicator | Reagent / Kit |
|---|---|---|
| Cellular Metabolism | Extracellular OCR | Extracellular OCR Plate Assay Kit |
| Glycolysis/OXPHOS | Glycolysis/OXPHOS Assay Kit | |
| Lactate | Lactate Assay Kit-WST | |
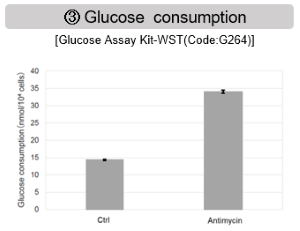
| Glucose | Glucose Assay Kit-WST | |
| ATP | ATP Assay Kit-Luminescence | |
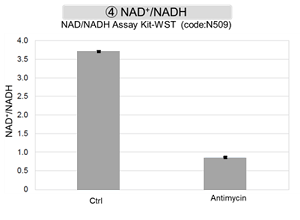
| NAD/NADH | NAD/NADH Assay Kit-WST | |
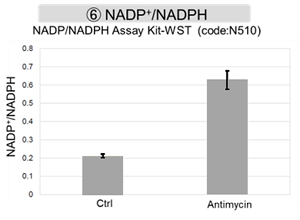
| NADP/NADPH | NADP/NADPH Assay Kit-WST | |
| Glutamine | Glutamine Assay Kit-WST | |
| Glutamate | Glutamate Assay Kit-WST | |
| α-Ketoglutarate | α-Ketoglutarate Assay Kit-Fluorometric | |
| Nutrient Uptake | Glucose Uptake | Glucose Uptake Assay Kit–Blue、Green、Red |
| Amino Acid Uptake | Amino Acid Uptake Assay Kit | |
| Cystine Uptake | Cystine Uptake Assay Kit | |
| Mitochondrial Analysis | Mitochondrial Membrane Potential | JC-1 MitoMP Detection Kit |
| Mitochondrial Membrane Potential | MT-1 MitoMP Detection Kit |

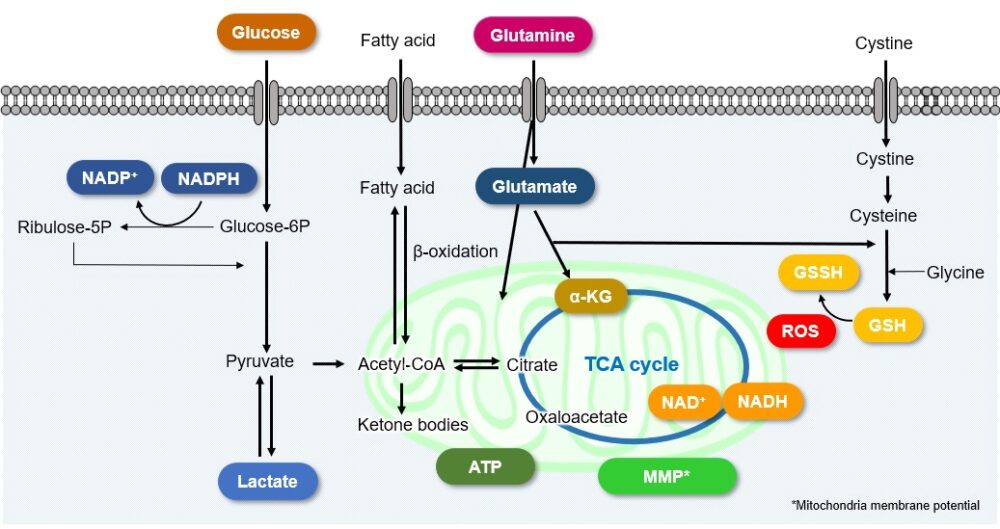
Analyzing the various intracellular metabolic pathways [e.g., the glycolysis system, the tricarboxylic acid (TCA) cycle, electron transport chain, etc.] is important when trying to understand cellular states. Metabolites and energy sources [e.g., glucose, lactate, and NAD(P)+/NAD(P)H] are the indicators used for analyzing intracellular metabolisms.
Cellular Metabolism and Disease
Intracellular metabolism in disease models such as cancer and diabetes has recently attracted great attention. The changes in metabolic indices associated with each disease are indicated here. Click to jump to academic and related metabolic info for each item
Cancer
Cancer cells rapidly take in large amounts of nutrients in order to maintain active cell growth. They metabolize these nutrients to synthesize and nucleic acids and to produce energy such as ATP. Even under unfavorable conditions, such as hypoxia or low nutrition, cancer cells can survive by altering their metabolic systems. Therefore, the metabolic systems of cancer cells have attracted many researchers’ attention.
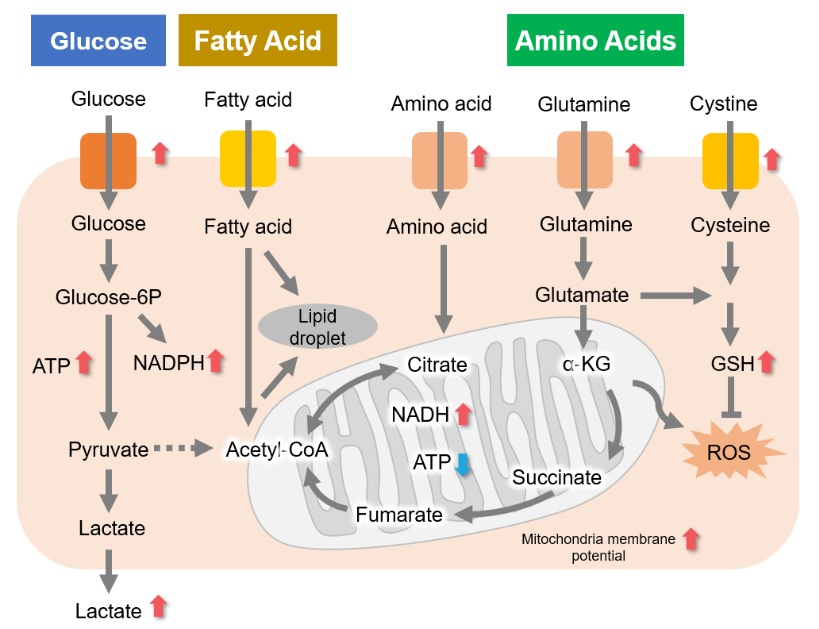
A recurring characteristic of cancer cell metabolism is that cancer cells generally prefer to produce ATP via the glycolytic system despite that system being less efficient than mitochondrial oxidative phosphorylation (Warburg effect). As a result, cancer cells take up large amounts of glucose. They also produce a large amount of lactate due to increased glycolytic activity. This method of ATP production allows cancer cells to proliferate even under hypoxia, because the glycolytic system does not require oxygen. Meanwhile, the mitochondria of cancer cells use amino acids and fats to produce NADH. It is commonly recognized that NADH in cancer cell mitochondria is mainly used for redox regulation in addition to ATP production. The abnormal functions of mitochondria in cancer cells result in increased mitochondrial membrane potential (hyperpolarization) and excessive ROS production. Consequently, they produce large amounts of glutathione to maintain the redox balance. Since glutamine and cysteine are essential nutrients for glutathione production, cancer cells take up large amounts of these amino acids. Additionally, since NADPH is required to maintain the reduction of glutathione, the pentose phosphate pathway (downstream from the glycolytic system) and NADH in mitochondria are used to maintain high NADPH levels.
(Note) The above information represents the general metabolic characteristics of cancer cells and may vary depending on the type of cancer cell and its environment.
References:
Below articles are general review on cancer cell metabolism.
1) Glycolytic system:
M. G. Vander Heiden, L. C. Cantley, and C. B. Thompson, “Understanding the Warburg Effect: The Metabolic Requirements of Cell Proliferation”, Science, 2009, 324, 1029.
2) Amino Acids metabolism, ROS:
P. Koppula, Y. Zhang, and B. Gan, “Amino Acid Transporter SLC7A11/xCT at the Crossroads of Regulating Redox Homeostasis and Nutrient Dependency of Cancer”, Cancer Commun., 2018, 38, 12.
3) Amino Acids:
E. L. Lieu, T. Nguyen, S. Rhyne, and J. Kim, “Amino Acids in Cancer”, Exp. Mol. Med., 2020, 52, 15.
4) Mitochondrial, ROS, NADPH:
F. Ciccarese and V. Ciminale, “Escaping Death: Mitochondrial Redox Homeostasis in Cancer Cells”, Front. Oncol., 2017, 7, 117.
5) NADH:
A. Chiarugi, C. Dolle, R. Felici, and M. Ziegler, “The NAD Metabolome-A Key Determinant of Cancer Cell Biology”, Nat. Rev. Cancer, 2012, 12, 741.
Cellular Metabolism Related Disease
- Glucose Metabolism Inhibition and Anticancer Effects
- Amino Acid Metabolism Inhibition and Anticancer Effects
- Fatty Acid Metabolism Inhibition and Anticancer Effects
- Cancer Immunity and Metabolism
Glucose Metabolism Inhibition and Anticancer Effects
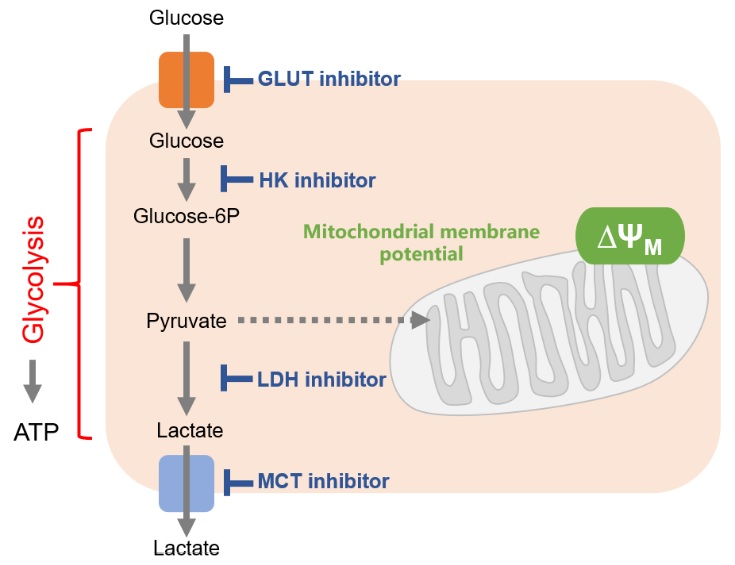
Cancer cells mainly use the glycolytic system to produce ATP. Thus, the glycolytic system is the most important pathway to understand in the metabolism of cancer cells. Consequently, the glycolytic system has long been a target of anticancer drug development. Although effective anticancer drugs have not yet been developed, the glycolytic system remains a major drug target.
One of the drug discovery target proteins of the glycolytic system is the glucose transporter (GLUT). Since cancer cells take up large amounts of sugar via glucose transporters, it is possible to suppress the glycolytic system by directly inhibiting glucose transporters. Inhibition of the enzymes responsible for glucose starvation and glycolysis [hexokinase (HK), lactate dehydrogenase (LDH), etc] as well as inhibition of the efflux of lactate (the end product of glycolysis) are also effective.
Changes in Intracellular Metabolism by Each Inhibitor / References
| Cell Line | Inhibitor / Inducer | Changes to Cellular Metabolism | Publication |
|---|---|---|---|
|
SKOV3, OVCAR3, HEY, A2780 |
GLUT1 inhibitor: BAY-876 |
ATP ↓, Lactate ↓ |
Cancer, 2019, 11, 33 |
|
H1299, H460, H2030 |
GLUT1 express inhibitor: Apigenin |
Glucose consumption ↓ Lactate ↓, ATP ↓ NADPH ↓, GSH/GSSG ↓ ROS ↓ |
Int. J. Oncol., 2016, 48, 399 |
|
HCT116 |
HK inhibitor: 2-DG |
Glucose uptake ↓ Lactate ↓, Acetyl-CoA ↓ H3K27Ac ↓ |
Cancer Metab., 2015, 3, 10 |
|
SKOV3, HEY |
HK inhibitor: 2-DG + Metformin |
ATP ↓, Lactate ↓ |
Am. J. Transl. Res., 2016, 8, 4821 |
|
CT26 |
Complex I inhibitor: Phenformin,
LDH inhibitor: Oxamate |
Glucose uptake ↓ Lactate ↓, ATP ↓ ROS ↑ |
PLoS One., 2014, 9, e85576 |
|
P493 |
LDH inhibitor: FX11 |
ATP ↓, Lactate ↓ NADH/NAD ↑, ROS ↑ Mitochondrial MP ↓ |
Proc. Natl. Acad. Sci. USA, 2010, 107(5), 2037 |
|
Raji |
MCT inhibitor: AZD3965 |
Glucose uptake ↓ Intracellular Lactate ↑ (Extracellular Lactate ↓) |
Cancer Res., 2017, 77(21), 5913 |
Related Products
| Objective | Product Name | Code |
|---|---|---|
| Glucose Metabolism Assay | Glucose Assay Kit-WST | G264 |
| Glucose Uptake Assay | Glucose Uptake Assay Kit-Green | UP02 |
| Lactic Acid Measurement | Lactate Assay Kit-WST | L256 |
| NAD+/NADH Assay | NAD/NADH Assay Kit-WST | N509 |
| NADP+/NADPH Assay | NADP/NADPH Assay Kit-WST | N510 |
|
JC-1 Mitochondrial Membrane Potential Detection |
JC-1 MitoMP Detection Kit | MT09 |
| MT-1 Mitochondrial Membrane Potential Detection | MT-1 MitoMP Detection Kit | MT13 |
Amino Acid Metabolism Inhibition and Anticancer Effects
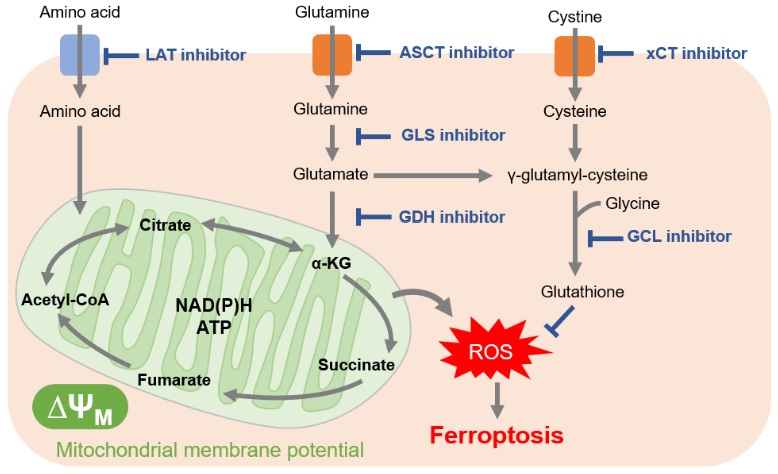
In cancer cells, which are actively proliferating, amino acids are essential for the synthesis of proteins and nucleic acids. Furthermore, many cancer cells downregulate acetyl CoA production from pyruvate, requiring cancer cells to also use amino acids as nutrient sources for the TCA cycle. This explains why cancer cells have been shown to increase expression of amino acid transporters to take up large amounts of amino acids.
Glutamine in particular is a raw material for glutathione and a source of α-ketoglutarate, which is essential for the TCA cycle. For these reasons, glutamine uptake and glutaminolysis (glutamine metabolism) have attracted attention as drug targets. As well, the amino acid transporter LAT (L-type amino acid transporter), which is involved in the uptake of many essential amino acids, was found to be overexpressed in many cancer cells. LAT is expected to a be future drug target.
Because cancer cells produce a large amount of reactive oxygen species, they maintain redox balance by increasing the production of glutathione, an antioxidant. Thus, inhibition of the pathways involved in glutathione production can change the intracellular redox balance and induce methods of cell death such as ferroptosis. In addition to the reason just stated, glutathione also contributes to drug resistance, which is why the pathway involved in glutathione production has become a major target for drug development.
Cysteine is an amino acid also required for redox regulation and is mainly taken up into cells by the cystine transporter (xCT). Sulfasalazine, long used as an anti-inflammatory drug, and sorafenib, a molecular targeted therapy for cancer, have recently been shown to inhibit xCT. For the same cell death-mediated anticancer effect as glutathione inhibition, xCT has also attracted attention as a target for drug development.
Changes in Intracellular Metabolism by Each Inhibitor / References
| Cell Line | Inhibitor / Inducer | Changes to Cellular Metablism | Publication |
|---|---|---|---|
|
KO99L |
LAT1 inhibitor: JPH203 |
Mitochondrial MP ↓ Autophagy ↑ |
Leukemia, 2015, 29, 1253 |
|
LS174T A549 |
LAT1 inhibitor: JPH203 |
Glutamine uptake ↓ Leucine uptake ↓ |
J. Biol. Chem., 2018, 293(8), 2877 |
|
HeLa |
LAT1 inhibitor: BCH |
Tryptophan uptake ↓ |
J. Immunol., 2011, 187(4), 1617 |
|
A549 |
ASCT2 inhibitor: GPNA |
Glutamine uptake ↓ ROS ↑ |
Clin. Cancer Res., 2013, 19(3), 560 |
|
MG63.3 |
GLS inhibitor: CB839 |
Glutamine ↑ Glutamate ↓, GSH ↓ |
Cancer&Metab., 2020, 8:4 |
|
OCI-AML3 |
GLS inhibitor: CB839 |
ATP ↓, NADH/NAD ↓ GSH/GSSG ↓, Alanine ↓ Glutamate ↓ |
Mol. Cancer Ther., 2019, 18(11), 1937 |
|
H1299 MDA-MB231 |
GDH inhibitor: R162 |
ROS ↑ GPx activity ↓ |
Cancer Cell, 2015, 27, 257 |
|
A2780 |
xCT inhibitor: Erastin |
Cystine uptake ↓ GSH ↓ |
Sci. Rep., 2018, 8(1), 968 |
|
B16-F10 |
xCT inhibitor: Sulfasalazine |
GSH ↓ ROS ↑ |
PLoS One., 2018, 13(4), e0195151. |
|
HT-1080 |
xCT inhibitor: Sorafenib |
Cystine uptake ↓, GSH ↓ Lipid peroxidation ↑ |
Elife, 2014, 3, e02523 |
|
PANC-1 |
GCL inhibitor: BSO |
GSH ↓ Lipid peroxidation ↑ |
Oncol. Lett., 2018, 15(6), 8735 |
|
A549 |
GCL inhibitor: BSO |
Cystine uptake ↓, GSH ↓ |
Toxicol. Appl. Pharmacol., 1985, 381 |
Related Products
| Objective | Product Name | Code |
|---|---|---|
| NAD+/NADH Assay | NAD/NADH Assay Kit-WST | N509 |
| JC-1 Mitochondrial Membrane Potential Detection | JC-1 MitoMP Detection Kit | MT09 |
| MT-1 Mitochondrial Membrane Potential Detection | MT-1 MitoMP Detection Kit | MT13 |
| Total ROS Detection | ROS Assay Kit-Highly Sensitive DCFH-DA- | R252 |
| Glutamine Assay | Glutamine Assay Kit-WST | G268 |
| Glutamate Assay | Glutamate Assay Kit-WST | G269 |
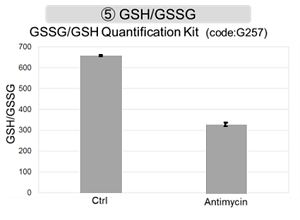
| Glutathione Quantification | GSSG/GSH Quantification Kit | G257 |
| Lipid Peroxide Detection | Liperfluo | L248 |
| Mitochondrial Lipid Peroxide Detection | MitoPeDPP | M466 |
| Autophagosome Detection | DAPGreen – Autophagy Detection | D676 |
| DAPRed – Autophagy Detection | D677 |
Fatty Acid Metabolism Inhibition and Anticancer Effects
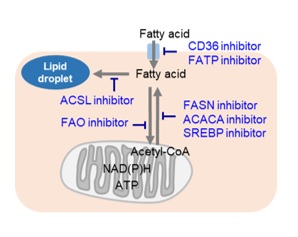
Cancer cells, which are actively proliferating, naturally require a large amount of lipids. Thus, intracellular fatty acid synthesis and extracellular fatty acid uptake are both very active. Therefore, many cancer cells have enhanced lipid droplet accumulation. Consequently, the pathway involved in fatty acid production is a very popular therapeutic target for cancer, and many inhibitors have been developed. Additionally, cancer cells perform β-oxidation of fatty acids for efficient energy production in order to compensate for inefficient energy production by the glycolytic system. Thus, drugs targeting the β-oxidation of fatty acids are also being developed.
Changes in Intracellular Metabolism by Each Inhibitor / References
| Cell Line | Inhibitor / Inducer | Changes to Cellular Metabolism | Publication |
|---|---|---|---|
|
CD36 Highly expressed MCF7, SUM159 |
CD36 inhibitor: SSO |
Fatty acid uptake ↓ Lipid droplet ↓ |
Cancers, 2019, 11, 2012 |
|
A375, SKMel28 |
FATP inhibitor: Lipofermata |
Fatty acid uptake ↓ Lipid droplet ↓ |
Cancer Discov., 2018, 8(8), 1006 |
|
BT474, MCF7, T47D |
ACACA inhibitor: TOFA |
Lipid droplet ↓ FA oxidation ↓ |
J. Clin. Med., 2020, 9, 87 |
|
ccRCC |
SREBP inhibitor: Betulin
ACACA inhibitor: TOFA FASN inhibitor: C75 |
Lipid droplet ↓ |
Mol. Cell Biol., 2017, 37(22), e00265-17 |
|
NCI-H1703 |
ACSL inhibitor: Triacsin C |
Lipid droplet ↓ |
Int. J. Cancer, 2020, 147, 1680 |
|
UM-UC-3 |
FAO inhibitor: Etomoxir |
Lipid droplet ↑ ATP ↓, NADPH ↓ |
Clin. Sci., 2019, 133 (15), 1745 |
|
SF188 |
FAO inhibitor: Etomoxir |
ATP ↓, NADPH ↓ GSH ↓ ROS ↑ |
Biochim. Biophys. Acta, 2011, 1807(6), 726 |
Related Products
| Objective | Product Name | Code |
|---|---|---|
| Lipid Droplet Assay | Lipid Droplet Assay Kit – Blue | LD05 |
| Lipid Droplet Assay Kit – Deep Red | LD06 | |
| Lipid Droplet Staining | Lipi-Blue | LD01 |
| Lipi-Green | LD02 | |
| Lipi-Red | LD03 | |
| Lipi-Deep Red | LD04 | |
| NADP+/NADPH Assay | NADP/NADPH Assay Kit-WST | N510 |
| Glutathione Quantification | GSSG/GSH Quantification Kit | G257 |
| Total ROS Detection | ROS Assay Kit -Highly Sensitive DCFH-DA- | R252 |
Cancer Immunity and Cellular Metabolism

T cells play a central role in the immune system by eliminating cancer cells. In recent years, it has become clear that metabolism is also involved in the regulation of T cell functions such as differentiation and activation, inspiring more active research on metabolism in cancer immunity.
Cancer cells take in large amounts of nutrients to maintain their proliferative activity. Activated T cells also require large amounts of nutrients to eliminate cancer cells. Cancer cells and activated T cells thus compete for nutrients – particularly glucose.
Activated T cells express the PD-1 immune checkpoint receptor on their surface. Cancer cells, in turn, express PD-L1, as the interaction will suppress T cell glucose uptake. It is in this way that cancer cells will regulate the metabolism of immune cells in order to evade the immune system. Therefore, it is important to understand the metabolism of not only cancer cells but also immune cells for the sake of cancer immunology.
References:
1) Z. Yin, L. Bai, W. Li, T. Zheng, H. Tian, and J. Cui, “Targeting T cell metabolism in the tumor microenvironment: an anti-cancer therapeutic stratety”, J. Exp. Clin. Cancer Res. 2019, 38, 403.
2) L. Almeida, M. Lochner, L. Berod, and T. Sparwasser, “Metabolic pathways in T cell activation and linear differentiation”, Semin. Immunol. 2016, 28(5), 514.
3) A. Kumar and K. Chamoto, “Immune metabolism in PD-1 blockage-based cancer immunotherapy”, Int. Immunol., 2020 Jul 5;dxaa046.
4) D. G. Franchina, F. He, and D. Brenner, “Survival of the fittest: Cancer challenges T cell metabolism”, Cancer Lett., 2018, 412, 216.
5) N. Patsoukis, K. Bardhan, P. Chatterjee, D. Sari, B. Liu, L. N. Bell, E. D. Karoly, G. J. Freeman, V. Petkova, P. Seth, L. Li, and V. A. Boussiotis, “PD-1 alters T-cell metabolic reprogramming by inhibiting glycolysis and promoting lipolysis and fatty acid oxidation”, Nat. Commun., 2015, 6, 6692.
Changes in Intracellular Metabolism by Each Inhibitor / References
|
Cell Line |
Antigen Activation |
Changes to Cellular Metabolism |
Publication |
|---|---|---|---|
|
T cell |
Activation |
Glucose uptake ↑ |
J. Immunol., 2008, 180, 4476 |
|
CD8(+) T cell |
Activation |
Glucose uptake ↑ |
J. Clin. Invest., 2013, 123, 4479 |
|
CD4(+) T cell |
Activation |
Glucose uptake ↑ Lactate ↑, ATP ↑ |
eLife, 2018, 7, e30938 |
|
CD4(+) T cell |
Activation |
Glucose uptake ↑, Lactate ↑ Glutamine uptake ↑ FAO ↓ |
Nat. Commun., 2015, 6, 6692 |
| CD4(+) T cell |
Activation (Interactions between PD-1 & PDL1) |
Glucose uptake ↓, Lactate ↓ Glutamine uptake ↓ FAO ↑ |
Related Products
| Objective | Product Name | Code |
|---|---|---|
| Glucose Metabolism Assay | Glucose Assay Kit-WST | G264 |
| Glucose Uptake Assay | Glucose Uptake Assay Kit-Green | UP02 |
| Lactate Detection | Lactate Assay Kit-WST | L256 |
| Glutamine Detection | Glutamine Assay Kit-WST | G268 |
| Glutamate Detection | Glutamate Assay Kit-WST | G269 |
| ATP Measurement | ATP Assay Kit-Luminescence | A550 |
Diabetes
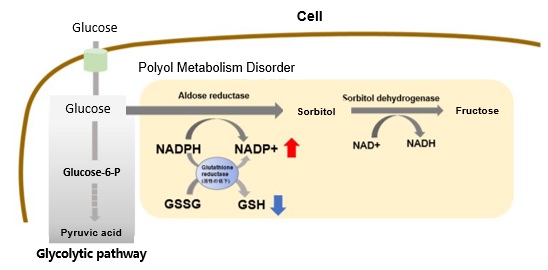
Hyperglycemic State and Increased Polyol Metabolism
In hyperglycemic conditions, intracellular glucose concentration increases and polyol pathway metabolism is enhanced. This leads to excessive consumption of NADPH and a decrease in reduced glutathione (GSH).
Overall, this results in increased oxidative stress and accelerated cellular damage.
Reference:
M. Brownlee, “The pathobiology of diabetic complications: a unifying mechanism”, DIABETES, 2005, 54, 1615.
Related Products
| Objective | Product Name | Code |
|---|---|---|
| NAD+/NADH Assay | NAD/NADH Assay Kit-WST | N509 |
| NADP+/NADPH Assay | NADP/NADPH Assay Kit-WST | N510 |
| Glutathione Quantification | GSSG/GSH Quantification Kit | G257 |
| Glucose Metabolism Assay | Glucose Assay Kit-WST | G264 |
| Glucose Uptake Assay | Glucose Uptake Assay Kit-Green | UP02 |
Senescence
- Relationship between Senescence-Related Diseases and Lactate/NAD+
- Senescence due to DNA Damage
- Glutamine Metabolism and Cellular Senescence
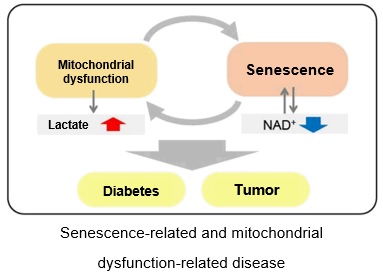
Relationship Between Senescence-Related Diseases and Lactate/NAD+
Recently, the relationship between NAD+ and senescence has been attracting attention. In the mouse aging model, a decreased amount of NAD+ was observed in the liver and other organs,1 whereas inhibition of NAD+ synthase has been reported to induce senescence-like decline in various cellular functions.2 Additionally, it has been suggested that a decrease in in NAD+ levels leads to decreased mitochondrial function,3 whereas a decrease in mitochondrial function has similarly been suggested to lead to a decrease in NAD+ levels and a senescence-like decline in cellular function.4
DNA Damage-Triggered Senescence
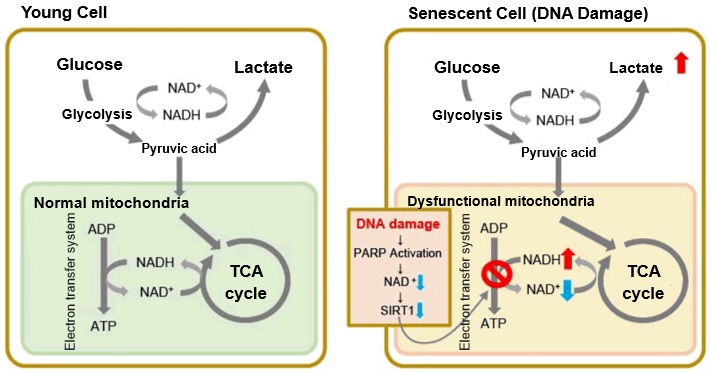
When mitochondrial function declines, ATP becomes more predominantly produced via anaerobic glycolysis, resulting in increased lactate production. DNA damage is one way cellular senescence can cause mitochondrial dysfunction.
The accumulation of DNA damage activates DNA repair mechanisms and increases NAD+ consumption. The decrease in available NAD+ decreases the activity of SIRT1, an important factor in maintaining mitochondrial function. Mitochondrial dysfunction results as decreased SIRT1 activity leads to inhibition of electron transfer, resulting in reduced ATP production and NAD+.3,8
Glutamine Metabolism and Cellular Senescence
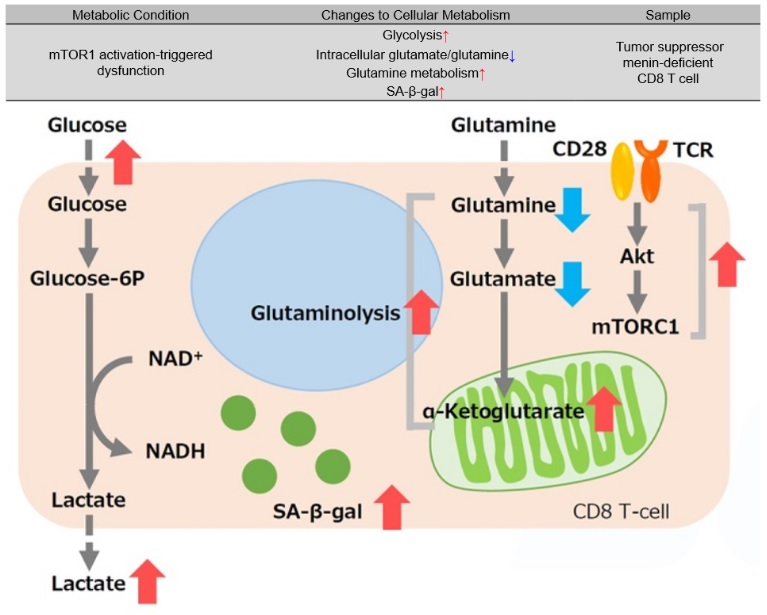
Tumor suppressor menin prevents effector CD8 T cell dysfunction by targeting mTORC1-dependent metabolic activation9
Menin is a tumor suppressor that plays an important role preventing T cell dysfunction from aging and fatigue. When menin is deficient, mTORC1 is activated, and oxidative phosphorylation via glycolysis and glutaminolysis is enhanced, leading to CD8 T cell dysfunction. Additionally, α-ketoglutarate, an intermediate product of glutamine metabolism, maintains the activation of mTORC1 and contributes to the promotion of cellular senescence (increased SA-β-gal activity). It has been suggested that the glutamine-α ketoglutarate pathway plays an important role in the induction of CD8 T cell dysfunction and that menin may inhibit T cell senescence.
References:
1) J. Yoshino, K. F. Mills, M. J. Yoon and S. Imai, “Nicotinamide mononucleotide, a key NAD+ intermediate, treats the pathophysiology of diet- and age-induced diabetes in mice”, Cell Metab., 2011, 14(4), 528.
2) L. R. Stein and S. Imai, “Specific ablation of Nampt in adult neural stem cells recapitulates their functional defects during aging”, EMBO J., 2014, 33(12), 1321.
3) J. Wu, Z. Jin, H. Zheng and L. Yan, “Sources and implications of NADH/NAD+ redox imbalance in diabetes and its complications”, Diabetes Metab. Syndr. Obes., 2016, 9, 145.
4) A. Bratic and N. Larsson, “The role of mitochondria in aging”, J Clin Invest. 2013, 123(3), 951.
5) I. San-Millancorresponding and G. A. Brooks, “Reexamining cancer metabolism: lactate production for carcinogenesis could be the purpose and explanation of the Warburg Effect”, Carcinogenesis, 2017, 38(2), 119.
6) Y. Wu, Y. Dong, M. Atefi, Y. Liu, Y. Elshimali, and J. V. Vadgama, “Lactate, a Neglected Factor for Diabetes and Cancer Interaction”, Mediators Inflamm., 2016. DOI: 10.1155/2016/6456018
7) Z. Feng, R. W. Hanson, N. A. Berger and A. Trubitsyn, “Reprogramming of energy metabolism as a driver of aging”, Oncotarget., 2016, 7(13), 15410.
8) S. Imai and L. Guarente, “NAD+ and sirtuins in aging and disease”, Trends in Cell Biology, 2014, 24(8), 464.
9) J. Suzuki, et al, “The tumor suppressor menin prevents effector CD8 T-cell dysfunction by targeting mTORC1-dependent metabolic activation.”, Commun Nat Commun, 2018, 9(1), 3296.
Related Products
| Objective | Product Name | Code |
|---|---|---|
| Cellular Senescence Detection(Microscopy/ FCM) | Cellular Senescence Detection Kit – SPiDER-βGal | SG04 |
| Cellular Senescence Detection(Plate Reader) | Cellular Senescence Plate Assay Kit – SPiDER-βGal | SG05 |
| JC-1 Mitochondrial Membrane Potential Detection | JC-1 MitoMP Detection Kit | MT09 |
| MT-1 MitoMP Detection Kit | MT13 | |
| α-Ketoglutaric Acid Measurement | α-Ketoglutarate Assay Kit-Fluorometric | K261 |
| Glucose Metabolism Assay | Glucose Assay Kit-WST | G264 |
MASH
Metabolic Dysfunction Associated Steatohepatitis (MASH)
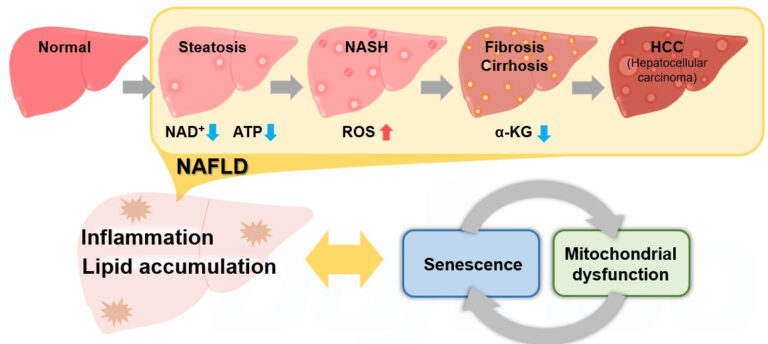
Metabolic Dysfunction Associated Steatotic Liver Disease (MASLD) is a pathological change in the liver that occurs predominantly in the elderly, regardless of drinking history. MASLD is a comprehensive disease concept that progresses from fatty liver (steatosis) through MASH to fibrosis/cirrhosis and finally hepatocellular carcinoma (HCC). 1
Recently, it has been reported that cellular senescence and associated mitochondrial dysfunctions contribute significantly to the development of MASLD/MASH, and these reports have attracted much attention. 2,3,4,5
Obesity, a risk factor for MASLD/MASH, increases lipid deposition, which then promotes the production of reactive oxygen species (ROS) and inflammatory cytokines, leading to cellular senescence. 2 The decrease in NAD+ levels associated with cellular senescence results in a decrease in mitochondrial function. 3 The decrease in mitochondrial function then leads to a further decrease in NAD+ levels, which exacerbates senescence-like changes in cellular function. 4
On the other hand, liver-specific induction of cellular senescence has been shown to increase lipid deposition and promote fibrosis.5 This indicates that cellular senescence, abnormal mitochondrial function, and associated metabolic changes produce a synergy in the development of MASLD/MASH, forming inflammatory and fibrotic pathologies.
In the future, more detailed analysis of the relationship between this complex synergy and MASLD/MASH is expected to contribute to the establishment of new treatments.
Reported cases in each MASLD/MASH model
* Click on the links in the table to visit the store pages of these measurement kits/reagents
| MASLD/MASH model | Cellular functions, metabolic changes, etc. | References |
|---|---|---|
|
Mouse model of aging, obesity, and diabetes |
Hepatocyte senescence(SA-ß-Gal ↑, p21 ↑) |
Nat. Commun., 2016, 8, 15691. |
|
Mice treated with high-fat + high-cholesterol diet |
Abnormal mitochondrial function in the liver |
Redox Biol., 2018, 15, 86-96 |
|
Mice treated with high-fat diet |
Abnormal mitochondrial function in liver(ATP ↓,NAD ↓),PARP ↑ |
J. Hepatol., 2017, 66, 132–141 |
|
Hepatic astrocyte fibrosis model |
a-ketoglutarate ↑,type I collagen ↑ |
Biosci. Rep., 2020, 40, BSR20193385 |
|
High-fat diet treated mice |
Lipid deposition in liver ↑,liver function ↓ |
Liver Res., 2020, 4, 94e10095 |
Reference:
1) T. Hardy, F. Oakley, Q. M. Anstee and C. P. Day, “Nonalcoholic fatty liver disease: pathogenesis and disease spectrum”, Annu. Rev. Pathol., 2016, 11, 451-496.
2) M. J. Schafer, et al, “Exercise Prevents Diet-Induced Cellular Senescence in Adipose Tissue”, Diabetes, 2016, 65, 1606-1615.
3) J. Wu, Z. Jin, H. Zheng and L. Yan, “Sources and implications of NADH/NAD+ redox imbalance in diabetes and its complications”, Diabetes Metab. Syndr. Obes., 2016, 9, 145.
4) A. Bratic and N. Larsson, “The role of mitochondria in aging”, J Clin Invest. 2013, 123(3), 951.
5) M. Ogrodnik, et al, “Cellular senescence drives age-dependent hepatic steatosis”, Nat. Commun., 2016, 8, 15691.
Others
Glutamine Metabolism and Autophagy
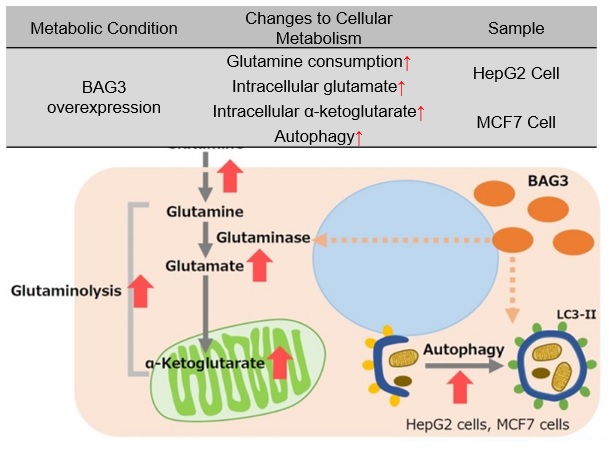
Promotion of autophagy and glutaminolysis via stabilization of glutaminase by BAG3
BAG3 is a protein involved in the regulation of various cellular functions, such as apoptosis, cell differentiation, and macroautophagy, etc. In cells overexpressing BAG3, glutaminase (GLS) succinylation is promoted, which prevents ubiquitination and subsequent proteosomal degradation, stabilizing the GLS protein. Stabilization of GLS promotes glutaminolysis, which in turn increases glutamine consumption. This results in increased intracellular glutamate and increased intracellular α-ketoglutarate, an intermediate product of glutamine metabolism. Accelerated glutaminolysis produces ammonia in the culture medium, which contributes to the activation of autophagy. For cancer cells with enhanced glutaminolysis, BAG3 has been suggested as a potential target for cancer therapy.
* BAG3 is a protein that is ubiquitously distributed in human tissues and is induced by various stresses. BAG3 is a protein involved in the regulation of various cellular functions and is also associated with cancer and age-related neurodegenerative diseases.
Reference:
S. Zhao, et al, “BAG3 promotes autophagy and glutaminolysis via stabilizing glutaminase”, Cell Death & Disease, 2019, 284(10).
Related Products
| Objective | Product Name | Code |
|---|---|---|
| α-Ketoglutaric Acid Measurement | α-Ketoglutarate Assay Kit-Fluorometric | K261 |
| Glutamine Assay | Glutamine Assay Kit-WST | G268 |
| Glutamate Assay | Glutamate Assay Kit-WST | G269 |
| Autolysosome Detection | DALGreen – Autophagy Detection | D675 |
| Autophagosome Detection | DAPGreen – Autophagy Detection | D676 |
| DAPRed – Autophagy Detection | D677 |