Ferroptosis: Mechanisms in Disease and Kit Selection

Science Note

Tumor Microenvironment Suppresses Ferroptosis via Iron and Lipid Control [Apr. 21, 2026] 

Previous Science Note

Ferroptosis is considered a promising therapeutic strategy for cancer, and control of the lipid peroxidation that drives this process is therefore of major importance. Cancer cells influence ferroptosis sensitivity by regulating lipid availability and iron metabolism. Clarifying how tumors control these processes is important for understanding treatment resistance and for identifying metabolically targetable vulnerabilities. Recent studies showed that metabolites derived from peritumoural adipose tissue suppress ferroptosis by inhibiting ferritinophagy in cancer cells. Another study showed that acidic tumors remodel the glycocalyx into a chondroitin sulfate rich surface barrier, thereby limiting extracellular lipid uptake while promoting lipid droplet formation to reduce ferroptotic stress. Together, these findings highlight microenvironment dependent regulation of lipid and iron metabolism as an important determinant of ferroptosis responses in tumors.

1. Peritumoural adipose tissue promotes ferroptosis resistance by 3-hydroxykynurenine-mediated suppression of ferritinophagy (Nature Cell Biology, 2026)
Summary: Cancer cells take up kynurenine released by peritumoural adipose tissue (PAT) and convert it intracellularly into 3-HK, which directly binds NCOA4 and blocks ferritinophagy, the NCOA4-mediated degradation of ferritin, thereby retaining iron within ferritin and depleting the free iron pool required for ferroptosis. Inhibiting kynurenine biosynthesis restored ferroptosis sensitivity and improved the efficacy of immune checkpoint blockade, identifying PAT–tumour metabolic crosstalk as a potential therapeutic target.

Highlighted technique: To test whether PAT and kynurenine-pathway metabolites alter ferroptosis-related oxidative damage and iron availability, the authors quantified lipid peroxidation in treated cancer cells using C11-BODIPY staining followed by flow cytometry. They also assessed intracellular ferrous iron using an iron assay kit, as well as FerroOrange-based detection by imaging or flow cytometry.

2. Tumour acidosis remodels the glycocalyx to control lipid scavenging and ferroptosis(Nature Cell Biology, 2026)
Summary: In this study, the authors showed that in the acidic microenvironment of aggressive tumors, cancer cells remodel the glycocalyx, a sugar-rich layer covering the cell surface, to form a chondroitin sulfate (CS)-rich surface structure that limits the uptake of extracellular lipid particles. This CS-rich surface barrier works together with lipid droplets that increase under acidic stress to protect tumor cells from lipid overload and ferroptosis, and the finding that simultaneous inhibition of CS-glycocalyx formation and lipid droplet formation triggers lipid peroxidation and ferroptotic cell death suggests a new therapeutic vulnerability in acidic tumors.

Highlighted technique: To examine lipid accumulation in acidic tumors, the authors visualized lipid droplets in patient tumor sections, patient-derived cells, and 3D spheroids using fluorescent probe–based imaging. They then fluorescently labeled extracellular vesicles, LDL, and HDL, and measured their binding to or uptake by cells with confocal microscopy and flow cytometry to assess extracellular lipid particle uptake.

Ferroptosis Indicators (click to open/close)
Target Kit & Probes
Ferroptosis Indicator: ferrous ion (Fe2+) FerroOrange (intracellular), Mito-FerroGreen (mitochondria)
Lysosomal ferrous ion (Fe2+) detection Lyso-FerroRed
Tissue Iron Detection Iron Assay Kit -Colorimetric-
Lipid Droplet Staining Lipi-Blue/ Green/ Red/ Deep Red
Ferroptosis Indicator: lipid peroxidation Liperfluo (intracellular), MitoPeDPP (mitochondria)
Lipid Peroxidation Assay Lipid Peroxidation Probe -BDP 581/591 C11-
Fatty Acid Uptake Capacity Assay Fatty Acid Uptake Assay Kit
Cystine Uptake detection Cystine Uptake Assay Kit
Malondialdehyde Detection MDA Assay Kit
Glutathione Quantification GSSG/GSH Quantification Kit
Application Note (click to open/close)
  > When Lysosomes Go Neutral: Iron Loss Unveiled

We investigated the transition of cellular metabolisms in A549 cells treated with erastin, a known ferroptosis inducer. Our results revealed the following.

Results
- The inhibition of cystine uptake by erastin led to a depletion of cysteine, which in turn increased the compensatory uptake of other amino acids.
- Glucose uptake, which typically promotes ferroptosis*, was found to decrease upon erastin treatment, suggesting a potential cellular self-defense mechanism.
- The depletion of cysteine resulted in a decrease in glutathione levels and an increase in Fe2+, ROS, and lipid peroxides, all of which are recognized markers of ferroptosis.

  Cell Line: A549
  Incubation Conditions: 100 μmol/l Erastin/MEM, 37℃, 3h
  *Reference: Xinxin Song, et al., Cell Reports, (2021)

Products in Use
① Amino Acid Uptake: Amino Acid Uptake Assay Kit
② Glucose Uptake: Glucose Uptake Assay Kit-Green
③ Cystine Uptake: Cystine Uptake Assay Kit
④ Intracellular glutathione: GSSG/GSH Quantification Kit
⑤ Intracellular labile Fe: FerroOrange
⑥ Intracellular total ROS: ROS Assay Kit -Highly Sensitive DCFH-DA-
⑦ Lipid Peroxides: Liperfluo


Why is ferroptosis research important?

Detection of ferroptosis is essential to elucidate its impact on neurodegenerative diseases and cancer, as it plays a role in neuronal loss in diseases such as Alzheimer's and Parkinson's, while also representing a potential therapeutic target in malignancies. Reliable detection of ferroptosis supports the development of neuroprotective strategies to slow disease progression and improves cancer treatment approaches by promoting ferroptotic cell death in therapy-resistant tumors.   Master the Basics with an Overview Map!
      
(Click to open)

What is Ferroptosis?

“Ferroptosis” was coined by Stockwell et al. at Columbia University in 2012 and described as a form of iron-dependent cell death. * It was reported to be a form of programmed cell death by the Nomenclature Committee on Cell Death (NCCD) in 2018.
Ferroptosis is a form of programmed cell death caused by iron ion-dependent accumulation of lipid peroxides. Ferroptosis has been shown to follow a different cell death pathway from apoptosis and thus is attracting attention as a new target for cancer therapy. It has also been found to be associated with various diseases, such as neurodegenerative diseases, cerebral apoplexy, and hepatitis (MASH).

*S. J. Dixon, B. R. Stockwell, et al.Ferroptosis: an iron-dependent form of nonapoptotic cell death., Cell2012, 149(5), 1060.
 

How Does Ferroptosis Cause Cell Death?

Ferroptosis is characterized by the accumulation of lipid peroxides. Lipid peroxides are formed from oxidation of polyunsaturated fatty acids (PUFA) in membrane phospholipids, with iron suggested to be involved. Intracellular glutathione peroxidase 4 (GPX4) uses reduced glutathione (GSH), an antioxidant, to reduce lipid peroxides generated by reactive oxygen species (ROS).*
However, when lipid peroxides accumulate due to GPX4 disruption or GSH depletion, ferroptosis is triggered.

*Stockwell et al, a leading researcher in the field of ferroptosis, summarized inhibitors, inducers, and detection indicators of ferroptosis in the following review, in which Dojindo’s Liperfluo is introduced for detection of lipid peroxides.

B. R. Stockwell, et al., "Ferroptosis: A Regulated Cell Death Nexus Linking Metabolism, Redox Biology, and Disease.", Cell, 2017, 171, 273.


Research on Related Diseases

Metabolic dysfunction-associated steatohepatitis (MASH)

Suppression of hepatitis via ferroptosis

In a study involving the livers of MASH model mice, it was confirmed that necrosis precedes apoptosis in the development of fatty liver. Further experiments showed that ferroptosis is involved within necrosis as a trigger for steatohepatitis and that inhibition of ferroptosis almost completely suppressed the onset of hepatitis.

Minoru Tanaka, et al., "Hepatic ferroptosis plays an important role as the trigger for initiating inflammation in nonalcoholic steatohepatitis", Cell Death & Disease201910, 449.

Related article: changes in intracellular markers associated with MASH

The article summarizes reports on changes in each indicator of metabolic states and cellular senescence using the NASH model.

(Click on the “MASH” tab in the link)


Experimental example: measurement of intracellular metabolism in MASH model tissue

Measurement of ATP, a-KG, and NAD levels in liver tissue of high-fat diet-treated type 1 diabetic model mice. (Please refer to each product’s website for more information, “Experimental Example: Change in Metabolism in Liver Tissue of MASH-Induced Mouse”)

Neurodegenerative disease

Confirmation of the link between lysosomal disorders and ferroptosis

In experiments using human neurons, it is reported that knockdown of the lysosomal protein prosaposin induces formation of lipofuscin, a hallmark of aging. This process involves the iron-catalyzed generation of reactive oxygen species, leading to induction of ferroptosis.

Martin Kampmann, et al., "Genome-wide CRISPRi/a screens in human neurons link lysosomal failure to ferroptosis", Nature Neuroscience202124, 1020

Cancer

Regulation of cancer immunity via ferroptosis

CD8+ T cells activated by immunotherapy were found to confer an anti-tumor effect by promoting lipid peroxidation and inducing ferroptosis. The mechanism of immunotherapy-induced inhibition of cystine uptake and promotion of lipid peroxidation in tumor cells is discussed.

Weiping Zou, et al, "CD8+ T cells regulate tumour ferroptosis during cancer immunotherapy", Nature2019569, 270

Ferroptosis-Related Reagent Selection Guide

Lipid Peroxide and Iron (Fe2+) Detection Reagents

Name Liperfluo MitoPeDPP

 Lipid Peroxidation Probe
-BDP 581/591 C11-

MDA Assay Kit Mito-FerroGreen FerroOrange
Target Lipid Peroxide Lipid Peroxidation Lipid Peroxidation Malondialdehyde Ferrous Ion(Fe2+) Ferrous Ion(Fe2+)
Localization Intracellular Mitochondria Intracellular Intracellular Mitochondria Intracellular
Detection
(Fluorescence:Ex/Em)
Fluorescence
(524 nm/535 nm)
Fluorescence
(452 nm/470 nm)
Fluorescence
1. 488 nm/510-550nm
2. 561 nm/600-630nm
Fluorescence
(540 nm/590 nm)
Colorimetric: 532 nm
Fluorescence
(505 nm/535 nm)
Fluorescence
(543 nm/580 nm)
Instrument Fluorescence Microscope,
FCM
Fluorescence Microscope,
FCM
Fluorescence Microscope,
FCM,
Microplate Reader
Microplate Reader Fluorescence Microscope,
Microplate Reader
Fluorescence Microscope
Sample Live Cell Live Cell Live Cell Cell, Tissue Live Cell Live Cell

Oxidative Stress- and Metabolism-Related Reagents and Kits

Name ROS Assay Kit
-Highly Sensitive DCFH-DA-
GSSG/GSH Quantification Kit Glutamine Assay Kit-WST Glutamate Assay Kit-WST
Target ROS (Reactive oxygen species) Glutathione (oxidized/reduced) Glutamine Glutamine
Localization Intracellular Intracellular Intracellular/Extracellular Intracellular/Extracellular
Detection
(Fluorescence:Ex/Em)
Fluorescence
(505 nm/525 nm)
Colorimetric:412 nm Colorimetric:450 nm Colorimetric:450 nm
Instrument Fluorescence Microscope,
FCM,
Microplate Reader
Microplate Reader Microplate Reader Microplate Reader
Sample Live Cell Cell, Tissue, Blood Plasma, Red Blood Cell Cell, Culture Medium Cell, Culture Medium

Experimental Example: Evaluating intracellular uptake and redox balance in erastin-induced ferroptosis


We investigated the transition of cellular metabolisms in A549 cells treated with erastin, a known ferroptosis inducer. Our results revealed the following.

Results
- The inhibition of cystine uptake by erastin led to a depletion of cysteine, which in turn increased the compensatory uptake of other amino acids.
- Glucose uptake, which typically promotes ferroptosis*, was found to decrease upon erastin treatment, suggesting a potential cellular self-defense mechanism.
- The depletion of cysteine resulted in a decrease in glutathione levels and an increase in Fe2+, ROS, and lipid peroxides, all of which are recognized markers of ferroptosis.

  Cell Line: A549
  Incubation Conditions: 100 μmol/l Erastin/MEM, 37℃, 3h
  *Reference: Xinxin Song, et al., Cell Reports, (2021)

Products in Use
① Amino Acid Uptake: Amino Acid Uptake Assay Kit
② Glucose Uptake: Glucose Uptake Assay Kit-Green
③ Cystine Uptake: Cystine Uptake Assay Kit
④ Intracellular glutathione: GSSG/GSH Quantification Kit
⑤ Intracellular labile Fe: FerroOrange
⑥ Intracellular total ROS: ROS Assay Kit -Highly Sensitive DCFH-DA-
⑦ Lipid Peroxides: Liperfluo


Experimental example: Changes in various indicators of cell death induced by drugs

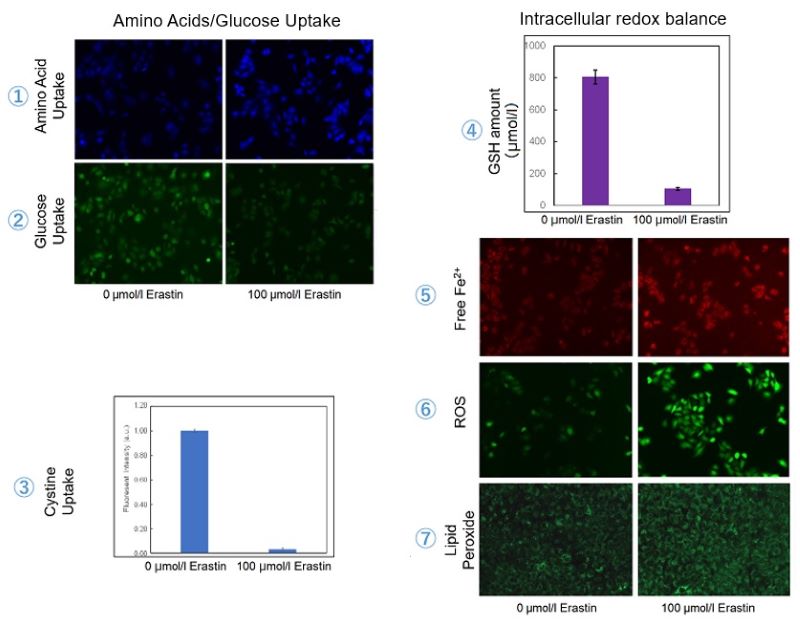
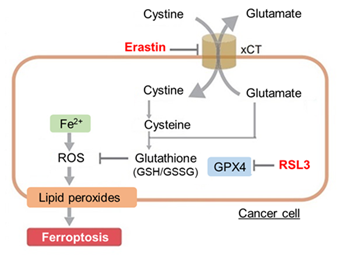
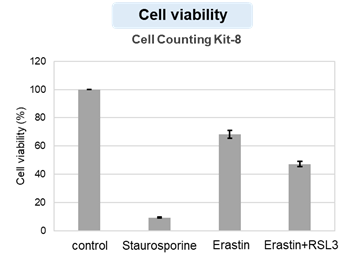
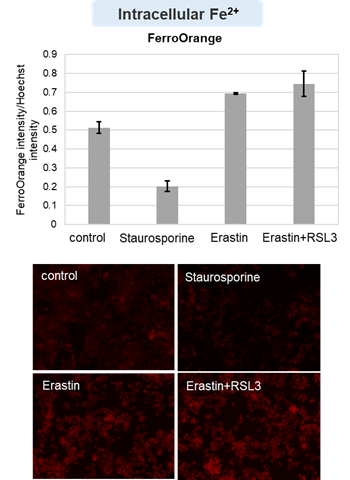
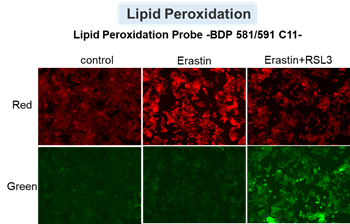
HepG2 cells treated with the apoptosis-inducing agent staurosporine or the ferroptosis-inducing agents Erastin and RSL3. After treatment, extracellular LDH, phosphatidylserine, cell viability, intracellular Fe2+ and lipid peroxidation were determined.
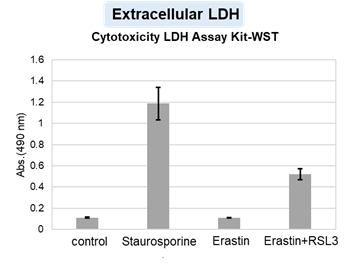
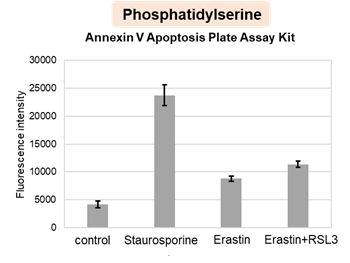
The results showed that apoptosis-induced cells treated with staurosporine showed an increase in phosphatidylserine, a decrease in cell viability and an increase in extracellular LDH, indicating that cell death had occurred. On the other hand, intracellular Fe2+, an indicator of ferroptosis, remained unchanged. In cells treated with Erastin, a ferroptosis inducer, intracellular Fe2+ increased and cell viability decreased, but extracellular LDH and lipid peroxidation (lipid peroxidation: decrease in red fluorescence and increase in green fluorescence) did not increase. In cells in which ferroptosis was more strongly induced by co-treatment with RSL3 in addition to Erastin, increased intracellular Fe2+ and lipid peroxidation were observed. Moreover, decreased cell viability and increased dead cells were detected. Meanwhile, phosphatidylserine showed a lower rate of increase during ferroptosis induction compared to apoptosis-induced cells. These results suggest that cell death can be distinguished by evaluating a combination of cell death indicators.

[Products in use]
Extracellular LDH  : Cytotoxicity LDH Assay Kit-WST (Product code: CK12)
Phosphatidylserine: Annexin V Apoptosis Plate Assay Kit(Product code: AD12)
Cell viability          : Cell Counting Kit-8 (Product code: CK04)
Intracellular Fe2+  : FerroOrange (Product cose: F374) *Normalized with Hoechst 33342 fluorescence intensity
Lipid peroxidation  : Lipid Peroxidation Probe -BDP 581/591 C11- (Product code: L267)

[Experimental conditions]
Cell type: HepG2 cell(2×10⁴ cells/well)
Drugs: Staurosporin(5 μmol/l), Erastin(25 µmol/l), Erastin+RSL3(both 25 µmol/l) *Diluted in serum-free medium


Product Classification

Product Classification