Mitochondria Research
Topics
Why is Mitochondrial Research Important?
|
Mitochondrial analysis is essential for understanding cellular energy metabolism because mitochondria regulate ATP production, redox balance, and signaling pathways. Thus, assessment of mitochondrial functions such as membrane potential, mitophagy, and respiration provides insight into cellular abnormalities, and these studies are critical in neurodegenerative diseases, cancer biology, and metabolic disorders, helping to uncover therapeutic targets and disease mechanisms. |
Selection Guide for Mitochondria-related Reagents
Mitochondria research is very multi-faceted, because the multi-functional organelle is not only involved in energy production in a cell, but other additional cellular functions. The active cycle of mitochondrial fusion and division induces morphological changes, which is called mitochondrial dynamics. Abnormalities in morphological control of mitochondria are associated with neurodegenerative diseases, metabolic disorders, aging, and so on. Therefore, the demand for long-term observation of mitochondrial dynamics has recently been increasing.
Selection Guide of Reagents
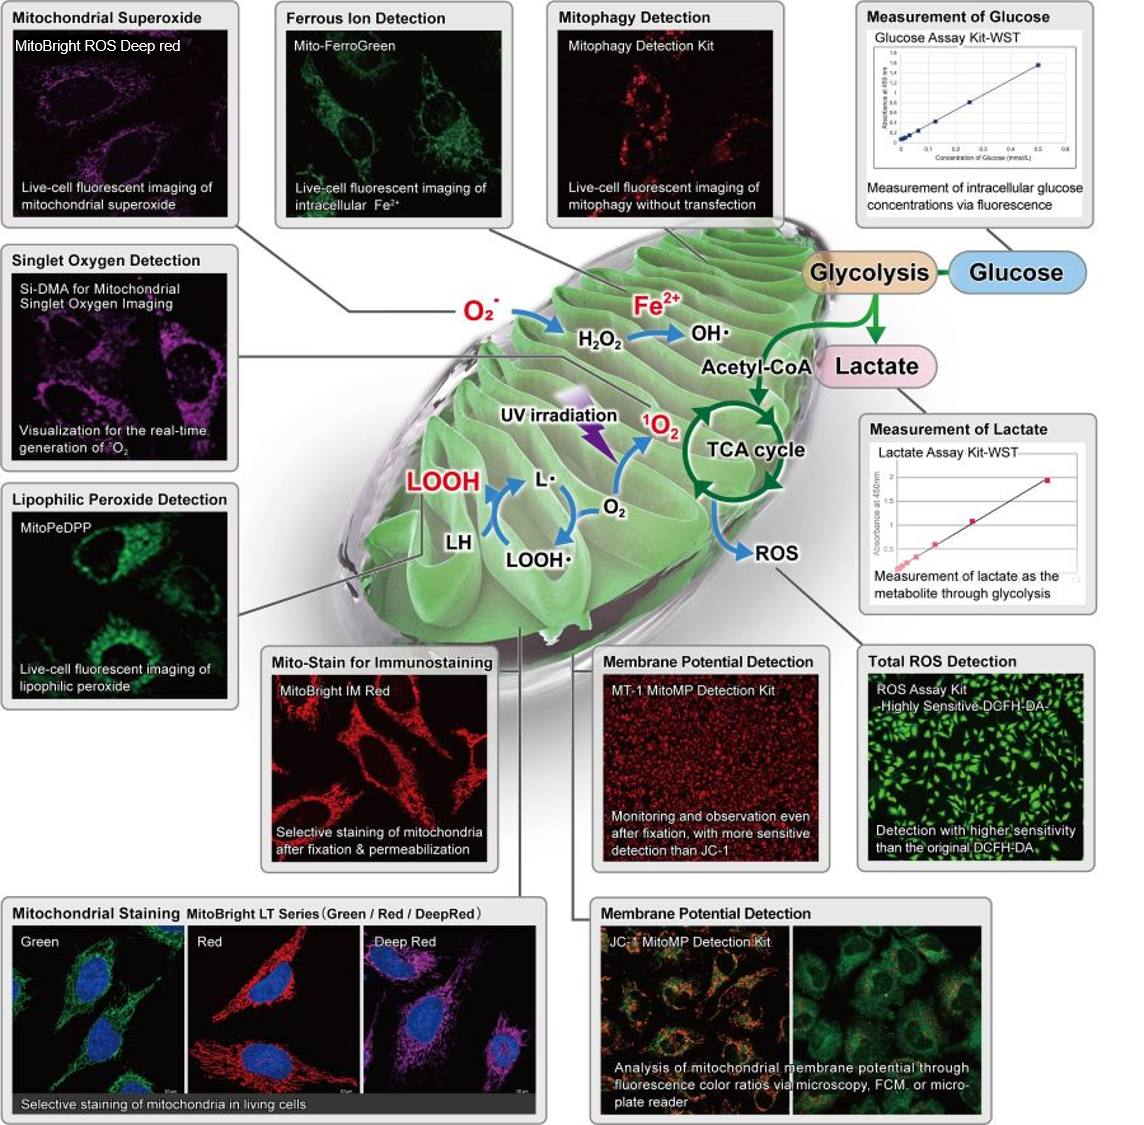
The following table lists reagents for mitochondrial research designed to stain and detect mitochondria (MitoBright LT, MitoTracker, etc.), mitochondrial membrane potential (JC-1, TMRM, TMRE, etc.), reactive oxygen species AKA ‘ROS’ (MitoBright ROS, MitoSOX, etc.), mitophagy, and lipid peroxides.
Mitophagy
| Mitophagy | ||
|---|---|---|
| Reagent | Mtphagy Dye | Keima-Red |
| Principle | Mtphagy Dye (included in Mitophagy Detection Kit) is a pH-sensitive fluorescent probe that accumulates in mitochondria and emits red fluorescence due to acidic conditions in a lysosome. | A pH-sentitive ratiometric fluorescent protein. The excitation spectrum changes accoring to pH. This protein shows high fluorescence ratio (Ex. 550 nm/440 nm) values in a lysozome. |
| Fixed cell staining | – | – |
| Live-cell staining | Yes | Yes |
| Fixation after live-cell staining | – | – |
| Staining time | > 30 min | – |
| Ex / Em | 530 / 700 | 440, 550 / 620 |
| Product code | MD01, MT02 | – |
Lipophilic peroxide / Singlet oxygen / Superoxide
| Lipophilic peroxide | Singlet oxygen | Superoxide | Superoxide | |
|---|---|---|---|---|
| Reagent | MitoPeDPP | Si-DMA | MitoBright ROS Deep Red | MitoSOX |
| Principle | A cell-permeant fluorescent probe that accumulates in mitochondria and specifically reacts with lipophilic peroxides in mitochondria to emit fluorescence. | A cell-permeant fluorescent probe that accumulates in mitochondria and specifically reacts with singlet oxigen generated in mitochondria to emit red fluorescence. | A cell-permeant fluorescent probe that accumulates in mitochondria and reacts with superoxide generated in mitochondria to emit fluorescence. | A cell-permeant fluorescent probe that accumulates in mitochondria and reacts with superoxide generated in mitochondria to emit red fluorescence. |
| Fixed cell staining | – | – | – | – |
| Live-cell staining | Yes | Yes | Yes | Yes |
| Fixation after live-cell staining | – | – | – | – |
| Staining time | > 15 min | > 45 min | > 10 min | > 10 min |
| Ex / Em | 452 / 470 | 644 / 670 | 540 / 670 | 510 / 590 |
| Product code | M466 | MT05 | MT16 | – |
Membrane potential
| Membrane potential | |||
|---|---|---|---|
| Reagent | JC-1 | MT-1 | TMRM, TMRE |
| Principle | A cell-permeant ratiometric fluorescent dye that accumulates in intact mitochondria due to the membrane potential. The excitation spectrum changes according to the mitochondria membrane potential. | Cell-permeant fluorescent dyes that accumulate in intact mitochondria due to the membrane potential. MT-1 is extremely photostable and more sensitive than JC-1 and can provide equivalent detection sensitivity to TMRE. | Cell-permeant fluorescent dyes that accumulate in intact mitochondria due to the membrane potential. Diffusion of the probes occurs in a damaged mitochondria that has the decreased membrane potential. |
| Fixed cell staining | – | – | – |
| Live-cell staining | Yes | Yes | Yes |
| Fixation after live-cell staining | – | Yes | – |
| Staining time | 30-60 min | 30 min | 30-60 min |
| Ex / Em | Monomer: 514 / 529 J-aggregation: 585/590 |
530-560 / 570-640 | 550 / 575 |
| Product code | MT09 | MT13 | – |
Mitochondria staining
| Mitochondria staining | ||||
|---|---|---|---|---|
| Reagent | MitoBright LT series | MitoBright IM Red | MitoTracker series | Rhodamine 123 |
| Principle | Cell-permeant fluorescent dyes that accumulate in intact mitochondria due to the membrane potential. | Cell-permeant fluorescent dyes that accumulate in intact mitochondria due to the membrane potential and covalently binds to proteins and other biomolecules. | Cell-permeant fluorescent dyes that accumulate in intact mitochondria due to the membrane potential. | Cell-permeant fluorescent dye that accumulates in intact mitochondria due to the membrane potential. |
| Fixed cell staining | – | – | – | – |
| Live-cell staining | Yes | Yes | Yes | Yes |
| Fixation after live-cell staining | Yes | Yes | – | – |
| Staining time | 30 min | 30 min | 15-45 min | > 15 min |
| Ex / Em | 493 / 508, 547 / 563, 643 / 663 | 548 / 566 | 490 / 516 ~ 644 / 665 |
507 / 529 |
| Product code | MT10, MT11,MT12 | MT15 | – | R233 |
Metal Ion Detection
| Iron ion (Fe2+) | Calcium ion (Ca2+) | |
|---|---|---|
| Reagent | Mito-FerroGreen | Rhod2-AM |
| Principle | A cell-permeant fluorescent probe that accumulates in mitochondria and specifically reacts with ferrous ion in mitochondria to emit green fluorescence. | A cell-permeant fluorescent probe that accumulates in mitochondria and specifically reacts with calcium ion in mitochondria to emit red fluorescence. |
| Fixed cell staining | – | – |
| Live-cell staining | Yes | Yes |
| Fixation after live-cell staining | – | – |
| Staining time | 30 min | 30-60 min |
| Ex / Em | 505 / 535 | 553 / 576 |
| Product code | M489 | R002 |
| Application | Products |
| Mitophagy Detection | Mitophagy Detection Kit |
| Mitochondrial Phospholipid Peroxidase Detection | MitoPeDPP |
| Mitochondrial Ferrous Ion Detection | Mito-FerroGreen |
| Mitochondrial Superoxide | MitoBright ROS - Mitochondrial Superoxide Detection |
| Mitochondrial Singlet Oxygen Detection | Si-DMA for Mitochondrial Singlet Oxygen Imaging |
| Mitochondrial Membrane Potential | JC-1 MitoMP Detection Kit MT-1 MitoMP Detection Kit |
| Mitochondria Staining | MitoBright LT Green MitoBright LT Red MitoBright LT Deep Red MitoBright IM Red for Immunostaining |
Cancer, Cell Death, and Mitochondria
-
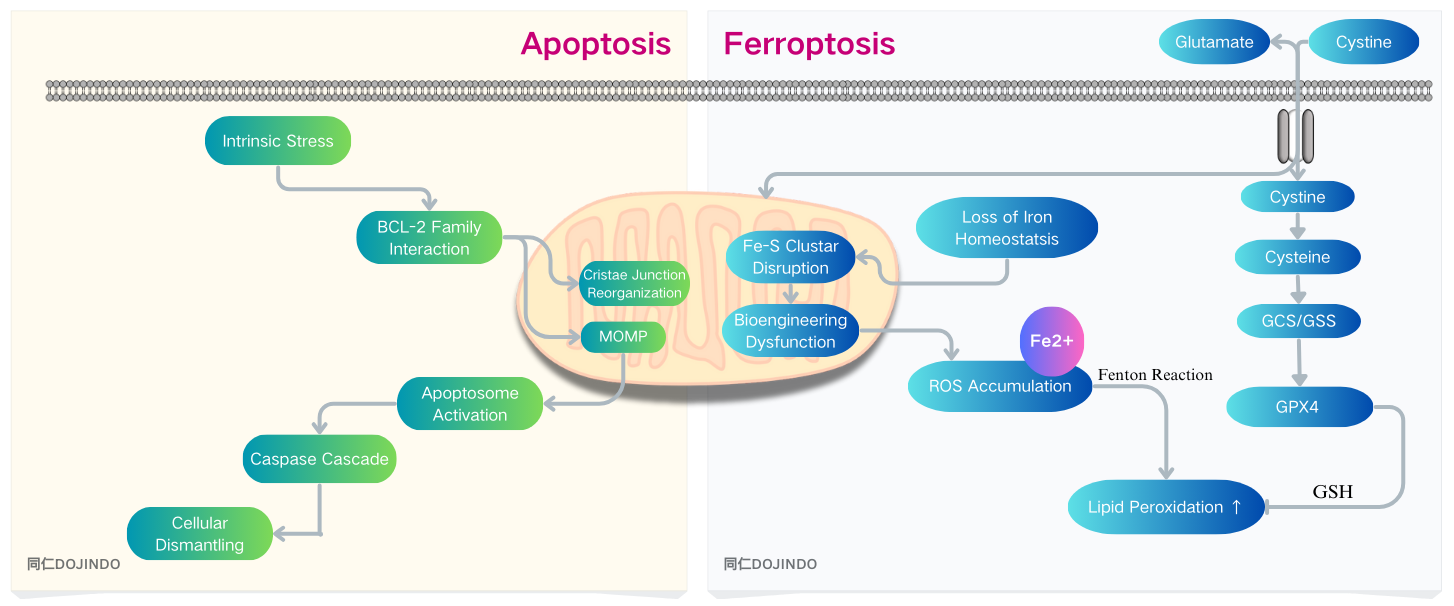
Apoptosis is a protective defense mechanism that effectively suppresses tumor growth and eliminates tumor cells.
One of the main mechanisms that trigger apoptosis is the increase in mitochondrial metabolic activity, which leads to elevated ROS levels in cancer cells. Excessive ROS damage mitochondrial function, causing mitochondrial membrane depolarization, which subsequently activates the intrinsic apoptosis pathway. Tumor cell immune evasion is a key feature of tumor pathophysiology, and mitochondria play a central role in both inhibiting and promoting immune evasion within the complex mechanisms involved in immune responses.1)
-
The Potential of Ferroptosis in Cancer Therapy: Many studies have found that ferroptosis sensitivity can be used to target tumors resistant to conventional therapies (such as triple-negative breast cancer and glioblastoma).2)
Ferroptosis and the Immune Microenvironment: Neutrophils in the tumour microenvironment die spontaneously by ferotosis and the lipid peroxide released suppresses T-cell activity, thereby suppressing tumour immunity.3)
Reference
1) Gao, J., Cancer Gene Therapy, 2024, 31, 970-983
2) Yang, F., Cell Metabolism, 2023, 35(1), 84-100
3) Kim, R., Nature, 2022, 612, 338-346
Click to View Product Details
 |
 |
Mitochondrial Function and Cellular Senescence
-
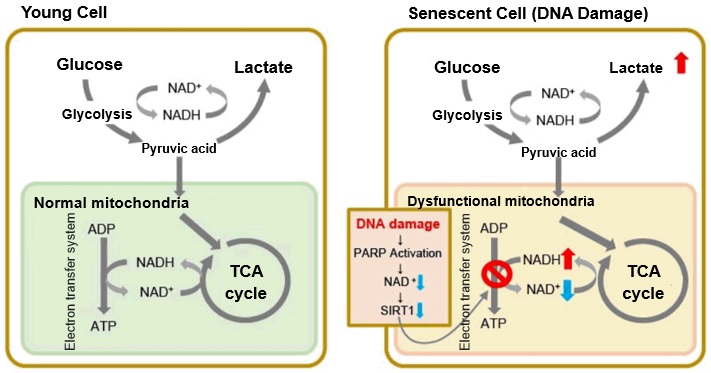
In senescent cells, due to mitochondrial dysfunction, ATP is primarily generated through the anaerobic glycolysis pathway, leading to an increase in lactate production2). DNA damage is one of the causes of mitochondrial dysfunction in cellular aging. The accumulation of DNA damage activates DNA repair mechanisms and increases NAD+ consumption. The decrease in NAD+ levels reduces SIRT1 activity, an important factor in maintaining mitochondrial function, leading to impaired mitochondrial function (inhibition of electron transfer → ATP production / reduction of NAD+ levels)1),3).
Reference:
1. J. Wu, Z. Jin, H. Zheng and L. Yan, “Sources and implications of NADH/NAD+redox imbalance in diabetes and its complications”, Diabetes Metab. Syndr. Obes., 2016, 9, 145
2. Z. Feng, R. W. Hanson, N. A. Berger and A. Trubitsyn, “Reprogramming of energy metabolism as a driver of aging”, Oncotarget., 2016, 7(13), 15410.
3. S. Imai and L. Guarente, “NAD+ and sirtuins in aging and disease”, Trends in Cell Biology, 2014, 24(8), 464.
Neurodegeneration-Autophagy and Mitochondrial Damage
| Indicator | Mitophagy | Mitochondrial fission abnormalities | ROS | MPTP (Mitochondrial Permeability Transition Pore) | MMP (Mitochondrial Membrane Potential) | ATP |
| Detection Kit | MD01 Mitophagy Detection Kit | MT10/MT11/MT12 MitoBright LT Green/Red/Deep Red | R252/R253 ROS Assay Kit |
- | MT09:JC-1 MT13:MT-1 | A550 ATP Assay Kit-Luminescence |
| Alzheimer's disease (AD) | ↓ | ✓ | ↑ | ↑ | ↓ | ↓ |
| Parkinson's disease (PD) | - | - | ||||
| Huntington's disease (HD) | - | - | - | |||
| Amyotrophic lateral sclerosis (ALS) | - | ↓ |
Refernce :
Role of Mitochondria in NeurodegenerativeDiseases: From an Epigenetic Perspective
Mitophagy / Autophagy Analysis Products
| Product Name | Probe 1 Dyes and Fluorescence Properties |
Probe 2 Dyes and Fluorescence Properties |
|---|---|---|
| Mitophagy Detection Kit | Mtphagy Dye Ex: 500-560 nm, Em: 670-730 nm |
Lyso Dye Ex: 350-450 nm, Em: 500-560 nm |
| Mtphagy Dye | Mtphagy Dye Ex: 500-560 nm / Em: 690-750 nm |
|
| Autophagic Flux Assay Kit* | DAPRed Ex: 500-560 nm / Em: 690-750 nm |
DALGreen Ex: 350-450 nm / Em: 500-560 nm |
*Autophagic Flux Assay Kit includes lysosome acidification Inhibitor as a negative control.